0

I have a table with the following data:

Offer | Metric_1 | Metric_2 | Metric_3
------|----------|----------|---------
AAA   |1         |2         | 3
BBB   |4         |5         | 6

I want to set up a slicer which picks which of Metric_2 or Metric_3 to display in a table visual, so that the results in the visual look like this:

With Metric_2 selected in the slicer:

Offer | Metric_1 | Metric_2 
------|----------|----------
AAA   |1         |2         
BBB   |4         |5 

With Metric_3 selected in the slicer:

Offer | Metric_1 | Metric_3
------|----------|---------
AAA   |1         |3
BBB   |4         |6

Does anyone know how to do this please?

SRJCoding
  • 335
  • 2
  • 15
  • why Metric_1 and Metric_3 when Metric_3 is selected? Which logic filtered out Metric_2? – mkRabbani Nov 18 '20 at 15:25
  • The slicer needs to be a dropdown menu where end users can select whether they want to see Metric_2 or Metric_3 along with Metric_1. This is because Metric_2 and Metric_3 are only of interest to select teams whereas Metric_1 is of interest to everyone. The idea is to minimise the number of fields shown to make the report more readable (there are actually many metrics; I've just simplified it to 3 in my example to get the point of what I'm trying to do across). – SRJCoding Nov 18 '20 at 15:32

2 Answers2

0

Making a single measure that switches between the results of Metric_2 and Metric_3 based on a slicer isn't too difficult but that wouldn't change the name in the column header.

To do stuff with the column headers, you'll need a new table for them and a switching measure like I've detailed here.

Alexis Olson
  • 38,724
  • 7
  • 42
  • 64
0

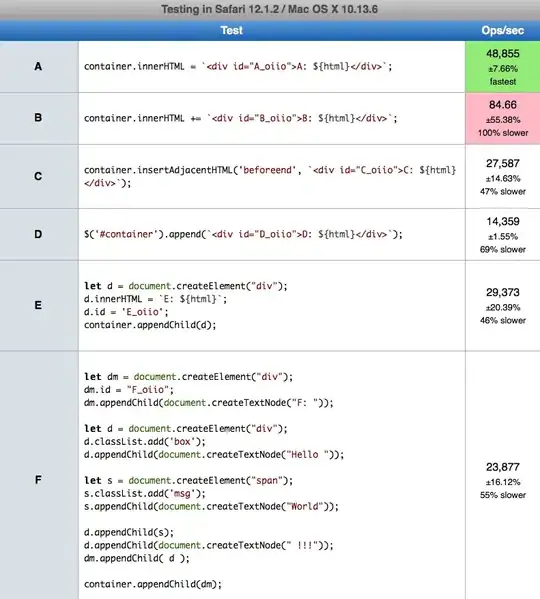
You can do some transformation in Power Query Editor to achieve the requirement. Go to Power Query Editor and let your data looks as below-

enter image description here

Now open Advance Editor for your table and incorporate these below code in your code-

let
    Source = Table.FromRows(Json.Document(Binary.Decompress(Binary.FromText("i45WcnR0VNJRMgRiIyA2VorViVZycnICsk0UgIQpEJspxcYCAA==", BinaryEncoding.Base64), Compression.Deflate)), let _t = ((type nullable text) meta [Serialized.Text = true]) in type table [Offer = _t, Metric_1 = _t, Metric_2 = _t, Metric_3 = _t]),
    #"Changed Type" = Table.TransformColumnTypes(Source,{{"Offer", type text}, {"Metric_1", Int64.Type}, {"Metric_2", Int64.Type}, {"Metric_3", Int64.Type}}),
    

    //-- NEW STEPS STARTS FROM HERE
    #"Unpivoted Other Columns" = Table.UnpivotOtherColumns(#"Changed Type", {"Offer", "Metric_1"}, "Attribute", "Value"),
    #"Unpivoted Other Columns1" = Table.UnpivotOtherColumns(#"Unpivoted Other Columns", {"Offer", "Attribute"}, "Attribute.1", "Value.1"),
    #"Added Custom" = Table.AddColumn(#"Unpivoted Other Columns1", "column_name", each if [Attribute.1] = "Value" then [Attribute] else [Attribute.1]),
    #"Removed Columns" = Table.RemoveColumns(#"Added Custom",{"Attribute.1"}),
    #"Reordered Columns" = Table.ReorderColumns(#"Removed Columns",{"Offer", "Attribute", "column_name", "Value.1"})
in
    #"Reordered Columns"

Here is the final output-

enter image description here

Now get back to report and do these below-

  1. Create the Slicer using the column Attribute

  2. Add a Metrix visual and configure as below-

    Rows: Offer

    Columns: column_name

    Values: value.1

here is final output-

enter image description here

mkRabbani
  • 16,295
  • 2
  • 15
  • 24