9

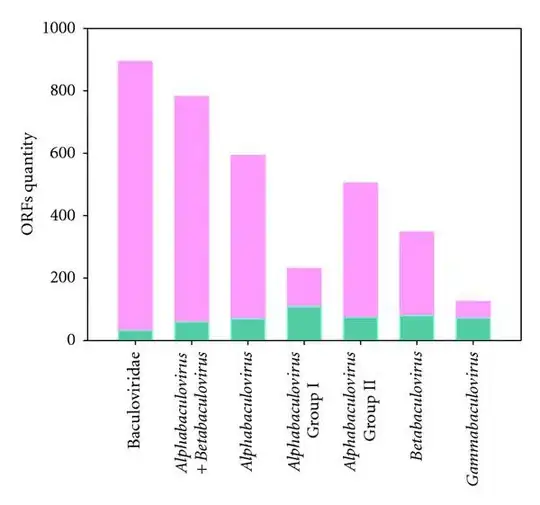
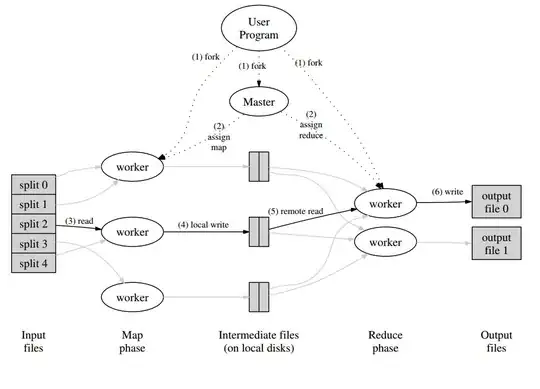
I would like to produce a plot like the following in matlab.
enter image description here

Or may be something like this enter image description here

Eric
  • 95,302
  • 53
  • 242
  • 374
Areza
  • 5,623
  • 7
  • 48
  • 79
  • Have you tried googling "multiple historgram matlab"? There are lots of resources on how to do this. – hughes Jun 24 '11 at 18:07
  • Related: [How can I create a barseries plot using both grouped and stacked styles in MATLAB?](http://stackoverflow.com/q/6012568/52738) – gnovice Jun 24 '11 at 18:39
  • 1
    by default matlab draw histogram for equal length matrix, and Icouldn't find any proper document to figure out how can I make histogram for unequal vector which Steve mentioned. – Areza Jun 25 '11 at 16:29

2 Answers2

15

You can use bar(...) or hist(...) to get the results you want. Consider the following code with results shown below:

% Make some play data:
x = randn(100,3);
[y, b] = hist(x);

% You can plot on your own bar chart:
figure(82);
bar(b,y, 'grouped');
title('Grouped bar chart');

% Bust histogram will work here:
figure(44);
hist(x);
title('Histogram Automatically Grouping');

% Consider stack for the other type:
figure(83);
bar(b,y,'stacked');
title('Stacked bar chart');

Group Bar Result Histogram Results Stacked Bar Result

If your data is different sizes and you want to do histograms you could choose bins yourself to force hist(...) results to be the same size then plot the results stacked up in a matrix, as in:

data1 = randn(100,1);       % data of one size
data2 = randn(25, 1);       % data of another size!

myBins = linspace(-3,3,10); % pick my own bin locations

% Hists will be the same size because we set the bin locations:
y1 = hist(data1, myBins);   
y2 = hist(data2, myBins);

% plot the results:
figure(3);
bar(myBins, [y1;y2]');
title('Mixed size result');

With the following results:

enter image description here

Pedro77
  • 5,176
  • 7
  • 61
  • 91
Steve
  • 3,957
  • 2
  • 26
  • 50
  • 1
    hist seems to return wrong values, histcounts is the way to go – Pedro77 Jun 21 '17 at 19:27
  • The bar positions are also wrong I think. They should be inside the interval defined in myBins, but they are at the myBins positions. There should be n-1 bars, n = numel(myBins). – Pedro77 Jun 21 '17 at 19:35
1

Doesn't hist already do the first one?

From help hist:

N = HIST(Y) bins the elements of Y into 10 equally spaced containers
and returns the number of elements in each container.  If Y is a
matrix, HIST works down the columns.

For the second look at help bar

Chris A.
  • 6,817
  • 2
  • 25
  • 43
  • No, I always prevent to ask trivial question! variables are not in same size, and hist doesn't draw them side by side. Hist draw them in front of each other !! – Areza Jun 24 '11 at 18:15
  • Ok, I see. But `bar` may be useful for the second one. – Chris A. Jun 24 '11 at 18:16
  • 1
    bar has the same problem, it plot bars over each other not again, sidebyside :) – Areza Jun 25 '11 at 12:23