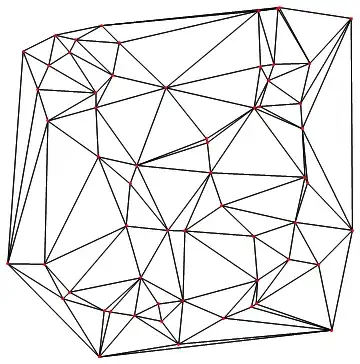
Method one, using polygons like Sjoerd, but without the problem caused by points on the convex hull:
Graphics[{FaceForm[], EdgeForm[Black],
  Polygon[pts[[#]] & /@
    DeleteCases[dtpts, {i_, _} /; MemberQ[ConvexHull[pts], i]][[All,
      2]]], Red, Point[pts]}]
Method two, using lines connecting the adjacent points:
edges[pts_, {a_, l_List}] := {pts[[a]], #} & /@ pts[[l]]
Graphics[{Line[edges[pts, #]] & /@ dtpts, Red, Point[pts]}]
Both of these methods result in duplicated primitives (three polygons or two lines, from using each point as a starting point.)
We can modify the data slightly and use built in visualization functions:
Graphics[{FaceForm[], EdgeForm[Black],
  Cases[Normal[
    ListDensityPlot[{##, 0.} & @@@ pts, Mesh -> All]], _Polygon,
   Infinity], Red, Point[pts]}, ImageSize -> 175]