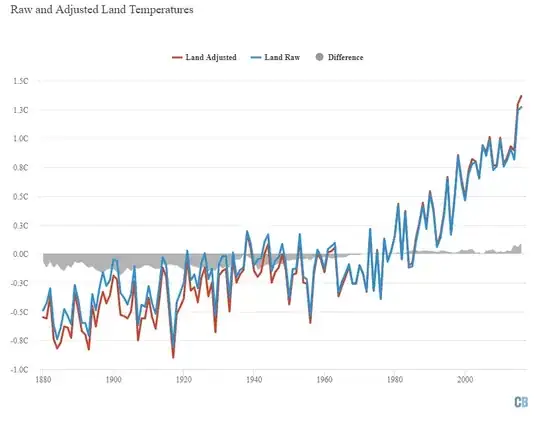
I would like to scrape the data in this interactive graph:
The isolated address is here: https://s3-eu-west-1.amazonaws.com/cbhighcharts/Temperature+adjustments/raw+adjusted+temps.html
I could just copy all the values (they are displayed when hovering over them), but there must be a better way. I realise it has been done using Highcharts, but the data is not embedded but comes from a protected google sheet:
data: {
          googleSpreadsheetKey: '1Ni5_AvLB_6M3YMZBPp5WlQshIvLM-WwRaUMdT-p_agM',
            startColumn: 0,
            endColumn: 3,
          complete: function(options) {
            var series = options.series;
            series[2].type = 'area';
            series[2].lineWidth = 0;
            series[2].zIndex = -1;
            series[2].color = '#999999';
          }
Any help how to get this into R?
Thanks!
Here the full html code:
<html>
<head>
    <title>Graph: Surface and troposphere temps | Carbon Brief</title>
<script src="https://code.jquery.com/jquery-1.12.0.min.js"></script>
<script src="https://code.highcharts.com/highcharts.js"></script>
<script src="https://code.highcharts.com/modules/data.js"></script>
<script src="https://code.highcharts.com/modules/exporting.js"></script>
</head>
<style>
   #container1 {max-width: 800px; height: 600px;}
   #logocontainer{ max-width: 800px; height: 26px;}
    #logo {position: absolute; right:10px;}
    @media screen and (min-width: 830px) {
        #logo {
            left: 778px;
        }
    }
</style>
<body>
    <!-- you can set minimum dimensions for the chart here -->
    <!-- for example swap the <div below for this version -->
    <!-- <div id="container" style="min-width: 310px; max-width: 600px; height: 400px; margin: 0 auto"></div> -->
        <div id="container1"></div>
  <div id="logocontainer">
    <img id="logo" src="https://s3-eu-west-1.amazonaws.com/cbhighcharts/CB-logo-for-highcharts.png">
  </div>
    <script type="text/javascript">
  $(function() {
    Highcharts.setOptions({
      // here is the CB colour scheme
      // dark blue - 0b4572
      // yellow - EFC530
      // light blue - 2f8fce
      // red - C7432B
      // light grey - 999999
      // lilac - A14A7B
      // orange - DF9239
      // this line sets the colours
      // the first colour is for bottom chunk of a stacked column (reversed: false)
      // here I've used a gradient of 15 steps from CB dark blue to red, via grey
      // you can make your own gradient custom here:
      // http://www.strangeplanet.fr/work/gradient-generator/?c=9:FFFFFF:000000
      lang: {
      thousandsSep: ','
      },
      chart: {
       //    set the font family for the chart. PT Serif is CB default for body text.
        style: {
          fontFamily: 'PT Sans'
        }
      }
    });
    // Create the chart
    // type: 'column'
    // creates column chart. See www.highcharts.com/demo/ for more options
    // zoomType: 'x,y'
    // allows the user to zoom in to the chart on the x and y axis
    // you can set to allow x zoom or y zoom only
    $('#container1').highcharts({
        colors: ['#C7432B', '#2f8fce', '#A14A7B', '#DF9239', '#C7432B', '#999999', '#A14A7B', '#EFC530', '#999999', '#999999' ],
          chart: {
          renderTo: 'container1',
          backgroundColor: 'transparent',
          type: 'line',
          zoomType: 'x,y'
        },
      title: {
        text: 'Raw and Adjusted Land Temperatures',
        align: 'left'
        },
      navigation: {
        buttonOptions: {
          enabled: false
        }
      },
        credits: {
        enabled: false
      },
        plotOptions: {
        line: {
          lineWidth: 3,
          symbol: 'circle',
          marker: {
            enabled: false,
            radius: 3
          }
        },
              column: {
                  groupPadding: 0
              }
      },
        // options for the y axis
      yAxis: {
              reversedStacks: false,
      min: -1,
      max: 1.5,
        labels: {
          style: {
            fontSize: '12px'
          },
          format: '{value:,.1f}C'
        },
        title: {
          text: ''
        },
    },
        xAxis: {
      //  type: 'category',
        crosshair: {
                      //  width: 40,
          // pale grey #E5E5E5
          // black #000000
                        color: '#E5E5E5'
                    },
          labels: {
            style: {
              fontSize: '12px'
            }
          }
        },
        tooltip: {
          valueSuffix: 'C',
                 pointFormat: '{series.name}: <br/> <b>{point.y}</b><br/>',
  //        crosshairs: 'true'
          shared: false
               },
         legend: {
          // turn the legend on or off
          enabled: true,
        padding: 20,
          // set the layout of the legend
        layout: 'horizontal',
          floating: false,
          verticalAlign: 'top',
           y: 20,
           //x: 15,
        },
        data: {
          googleSpreadsheetKey: '1Ni5_AvLB_6M3YMZBPp5WlQshIvLM-WwRaUMdT-p_agM',
            startColumn: 0,
            endColumn: 3,
          complete: function(options) {
            var series = options.series;
            series[2].type = 'area';
            series[2].lineWidth = 0;
            series[2].zIndex = -1;
            series[2].color = '#999999';
          }
      }
      },
      function(chart) { // on complete
      });
  });
    </script>
</body>
</html>
