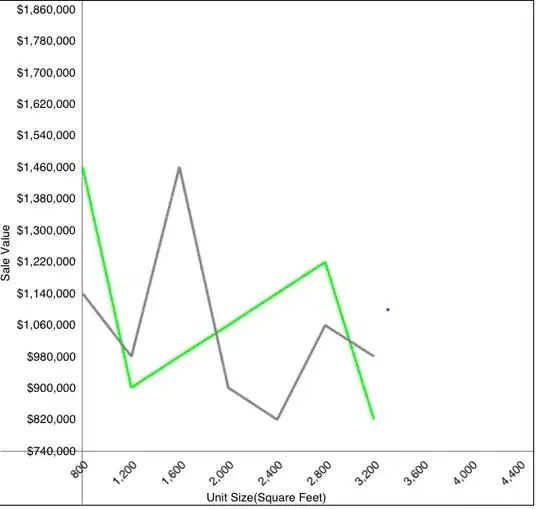
I'd like to add quivers to an existing figure with plotly (python). But the only peace of documentation I could find either create only one quiver (here) or a brand new figure (there).
Here's the example on plotly doc :
import plotly.figure_factory as ff

import numpy as np

x,y = np.meshgrid(np.arange(0, 2, .2), np.arange(0, 2, .2))
u = np.cos(x)*y
v = np.sin(x)*y

fig = ff.create_quiver(x, y, u, v)
fig.show()
If anyone has a better understanding of plotly that I do, I'd appreciate a lot a few explanations!
Thanks a lot,
