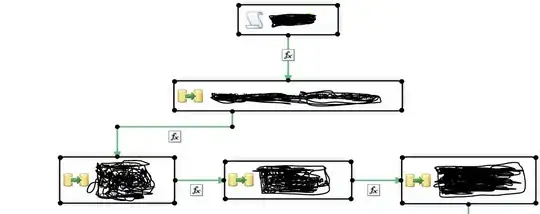
To do this with Power Query, the basic steps are
- Unpivot
- Filter out the blanks
- Group in pairs (
Group/Series)
- Extract the data
- split into new columns
Below is the M-Code. You can explore this by examining the "Applied Steps" where you can see the comments I made; and also, by clicking or double-clicking on each step, you can see what is being done.
There may be more efficient methods of doing this, as I am a relative beginner with PQ, but this should get you started.
BTW, the result will not be in the same order as you show, as PQ pulls things together row-wise rather than column-wise. But you can insert a sorting option if you need the results in a particular order.
M Code
let
    Source = Excel.CurrentWorkbook(){[Name="Table14"]}[Content],
    #"Changed Type" = Table.TransformColumnTypes(Source,{{"Micro", Int64.Type}, {"Group", type text}, {"Series", Int64.Type}, {"Group1", type text}, {"Series1", Int64.Type}, {"Group2", type text}, {"Series2", Int64.Type}, {"Group3", type text}, {"Series3", Int64.Type}}),

    //select Micro column and unpivot
    #"Unpivoted Other Columns" = Table.UnpivotOtherColumns(#"Changed Type", {"Micro"}, "Attribute", "Value"),

    //filter out the blanks
    #"Filtered Rows1" = Table.SelectRows(#"Unpivoted Other Columns", each ([Value] <> "")),

    //Split off the terminal number, so as to leave identical "former"column headers
    #"Split Column by Character Transition" = Table.SplitColumn(#"Filtered Rows1", "Attribute", Splitter.SplitTextByCharacterTransition((c) => not List.Contains({"0".."9"}, c), {"0".."9"}), {"Attribute.1", "Attribute.2"}),
    #"Removed Columns" = Table.RemoveColumns(#"Split Column by Character Transition",{"Attribute.2"}),

    //add index and create a series for grouping in pairs
    #"Added Index" = Table.AddIndexColumn(#"Removed Columns", "Index", 0, 1, Int64.Type),
    #"Inserted Integer-Division" = Table.AddColumn(#"Added Index", "Integer-Division", each Number.IntegerDivide([Index], 2), Int64.Type),
    #"Removed Columns1" = Table.RemoveColumns(#"Inserted Integer-Division",{"Index"}),

    //Group by the pairs
    #"Grouped Rows" = Table.Group(#"Removed Columns1", {"Integer-Division"}, {{"Grouped", each _, type table [#"Micro "=nullable number, Attribute.1=nullable text, Value=any, #"Integer-Division"=number]}}),

    //extract the Micro and Value columns from each grouped table
    //then split into new columns
    #"Added Custom" = Table.AddColumn(#"Grouped Rows", "Group", each List.Combine({{List.First(Table.Column([Grouped],"Micro"))},
Table.Column([Grouped],"Value")})),
    #"Extracted Values" = Table.TransformColumns(#"Added Custom", {"Group", each Text.Combine(List.Transform(_, Text.From), ";"), type text}),
    #"Split Column by Delimiter" = Table.SplitColumn(#"Extracted Values", "Group", Splitter.SplitTextByDelimiter(";", QuoteStyle.Csv), {"Group.1", "Group.2", "Group.3"}),

    //cleanup - set data types, remove unneeded columns
    #"Changed Type1" = Table.TransformColumnTypes(#"Split Column by Delimiter",{{"Group.1", Int64.Type}, {"Group.2", type text}, {"Group.3", Int64.Type}}),
    #"Renamed Columns" = Table.RenameColumns(#"Changed Type1",{{"Group.1", "Micro"}, {"Group.2", "Group"}, {"Group.3", "Series"}}),
    #"Removed Columns2" = Table.RemoveColumns(#"Renamed Columns",{"Integer-Division", "Grouped"}),

    //Group by "Group" and SUM
    #"Grouped Rows1" = Table.Group(#"Removed Columns2", {"Micro", "Group"}, {{"Series", each List.Sum([Series]), type nullable number}})
in
    #"Grouped Rows1"

