1

Loading packages, showing versions, and getting data for reproducibility:

import seaborn as sns; print("Seaborn:", sns.__version__)
import matplotlib as mpl; import matplotlib.pyplot as plt; print("Matplotlib:", mpl.__version__)
import pandas as pd; print("Pandas:", pd.__version__)
# Seaborn: 0.11.0
# Matplotlib: 3.3.1
# Pandas: 1.0.5
    
df = pd.read_csv("https://pastebin.com/raw/w53mAAXN", sep="\t", index_col=0)
vmax = df.abs().values.ravel().max()

figsize = (40,13)

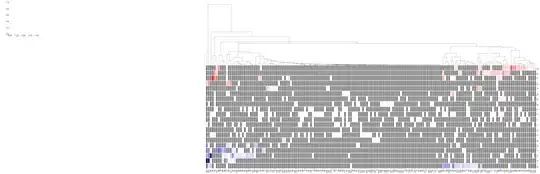
Trying clustermap with cbar=False leaves a HUGE whitespace and an empty ax object on the left:

with plt.style.context("seaborn-white"):
#     _, ax_null = plt.subplots(figsize=(0.1,0.1))
    g = sns.clustermap(df, 
                       cbar=False,
#                        cbar_ax=None, 
                       dendrogram_ratio=0.382, 
                       method="ward", 
                       row_cluster=False, 
                       metric="euclidean",  
                       mask=df == 0, 
                       figsize=figsize, 
                       cmap=plt.cm.seismic, 
                       edgecolor="white", 
                       linewidth=1, 
                       xticklabels=True,
                       vmax=vmax,
                       vmin=-vmax,
      )
    g.ax_heatmap.set_facecolor("gray")

image

Try clustermap with a very small custom cax. The same thing happens when cbar_ax=None:

with plt.style.context("seaborn-white"):
    _, ax_null = plt.subplots(figsize=(0.1,0.1))
    g = sns.clustermap(df, 
#                        cbar=False,
                       cbar_ax=ax_null, 
                       dendrogram_ratio=0.382, 
                       method="ward", 
                       row_cluster=False, 
                       metric="euclidean",  
                       mask=df == 0, 
                       figsize=figsize, 
                       cmap=plt.cm.seismic, 
                       edgecolor="white", 
                       linewidth=1, 
                       xticklabels=True,
                       vmax=vmax,
                       vmin=-vmax,
      )
    g.ax_heatmap.set_facecolor("gray")

---------------------------------------------------------------------------
TypeError                                 Traceback (most recent call last)
<ipython-input-86-f7a221f170c3> in <module>
     12 with plt.style.context("seaborn-white"):
     13     _, ax_null = plt.subplots(figsize=(0.1,0.1))
---> 14     g = sns.clustermap(df, 
     15 #                        cbar=False,
     16                        cbar_ax=ax_null,

~/anaconda3/envs/soothsayer5_env/lib/python3.8/site-packages/seaborn/_decorators.py in inner_f(*args, **kwargs)
     44             )
     45         kwargs.update({k: arg for k, arg in zip(sig.parameters, args)})
---> 46         return f(**kwargs)
     47     return inner_f
     48 

~/anaconda3/envs/soothsayer5_env/lib/python3.8/site-packages/seaborn/matrix.py in clustermap(data, pivot_kws, method, metric, z_score, standard_scale, figsize, cbar_kws, row_cluster, col_cluster, row_linkage, col_linkage, row_colors, col_colors, mask, dendrogram_ratio, colors_ratio, cbar_pos, tree_kws, **kwargs)
   1400                           colors_ratio=colors_ratio, cbar_pos=cbar_pos)
   1401 
-> 1402     return plotter.plot(metric=metric, method=method,
   1403                         colorbar_kws=cbar_kws,
   1404                         row_cluster=row_cluster, col_cluster=col_cluster,

~/anaconda3/envs/soothsayer5_env/lib/python3.8/site-packages/seaborn/matrix.py in plot(self, metric, method, colorbar_kws, row_cluster, col_cluster, row_linkage, col_linkage, tree_kws, **kws)
   1231 
   1232         self.plot_colors(xind, yind, **kws)
-> 1233         self.plot_matrix(colorbar_kws, xind, yind, **kws)
   1234         return self
   1235 

~/anaconda3/envs/soothsayer5_env/lib/python3.8/site-packages/seaborn/matrix.py in plot_matrix(self, colorbar_kws, xind, yind, **kws)
   1182         # Setting ax_cbar=None in clustermap call implies no colorbar
   1183         kws.setdefault("cbar", self.ax_cbar is not None)
-> 1184         heatmap(self.data2d, ax=self.ax_heatmap, cbar_ax=self.ax_cbar,
   1185                 cbar_kws=colorbar_kws, mask=self.mask,
   1186                 xticklabels=xtl, yticklabels=ytl, annot=annot, **kws)

TypeError: heatmap() got multiple values for keyword argument 'cbar_ax'

Produces large whitespace when disabled g.cax.set_visible(False):

with plt.style.context("seaborn-white"):
#     _, ax_null = plt.subplots(figsize=(0.1,0.1))
    g = sns.clustermap(df, 
#                        cbar=False,
#                        cbar_ax=None, 
                       dendrogram_ratio=0.382, 
                       method="ward", 
                       row_cluster=False, 
                       metric="euclidean",  
                       mask=df == 0, 
                       figsize=figsize, 
                       cmap=plt.cm.seismic, 
                       edgecolor="white", 
                       linewidth=1, 
                       xticklabels=True,
                       vmax=vmax,
                       vmin=-vmax,
      )
    g.ax_heatmap.set_facecolor("gray")
    g.cax.set_visible(False)

image

O.rka
  • 29,847
  • 68
  • 194
  • 309
  • The result is a bit different but it probably requires a similar solution, maybe this is helpful: https://stackoverflow.com/questions/47350879/seaborn-clustermap-subplots-adjust-cancels-colour-bar-relocation – runDOSrun Sep 10 '20 at 20:27

2 Answers2

3

Drop the dendrogram axis:

with plt.style.context("seaborn-white"):
#     _, ax_null = plt.subplots(figsize=(0.1,0.1))
    g = sns.clustermap(df, 
#                        cbar=False,
#                        cbar_ax=None, 
                       dendrogram_ratio=(0,0.382), # This line 
                       method="ward", 
                       row_cluster=False, 
                       metric="euclidean",  
                       mask=df == 0, 
                       figsize=figsize, 
                       cmap=plt.cm.seismic, 
                       edgecolor="white", 
                       linewidth=1, 
                       xticklabels=True,
                       vmax=vmax,
                       vmin=-vmax,
      )
    g.ax_heatmap.set_facecolor("gray")
    g.cax.set_visible(False)
O.rka
  • 29,847
  • 68
  • 194
  • 309
  • I misunderstood your question to be about removing the whitespace between the colorbar and the clustermap, not removing the colorbar entirely. Glad you figured it out though! – runDOSrun Sep 11 '20 at 07:03
  • @runDOSrun that was my mistake for not being more clear. Your answer is also helpful for people wanting to have more control of the color bar. Upvoting it now. – O.rka Sep 11 '20 at 14:13
2

Some of the ratios that you set (via figsize and dendrogram_ratio) affect how big the box becomes. I've left them out for now but if you want to optimize these ratios to your liking you will get the desired size for the colorbar. I've also added tight_layout which additionally helps.

df = pd.read_csv("https://pastebin.com/raw/w53mAAXN", sep="\t", index_col=0)
vmax = df.abs().values.ravel().max()

# figsize = (40, 13)

with plt.style.context("seaborn-white"):
#     _, ax_null = plt.subplots(figsize=(0.1,0.1))
#     cbar_ax = plt.gcf().add_axes([.91, .3, .03, .4])
    g = sns.clustermap(df,
                       cbar=True,
                       # cbar_kws = dict(use_gridspec=False,location="top"),
                       # dendrogram_ratio=0.382,
                       method="ward",
                       row_cluster=False,
                       metric="euclidean",
                       mask=df == 0,
                       # figsize=figsize,
                       cmap=plt.cm.seismic,
                       edgecolor="white",
                       linewidth=1,
                       xticklabels=True,
                       vmax=vmax,
                       vmin=-vmax,
      )
    plt.setp(g.ax_heatmap.get_xticklabels(), rotation=90)
    plt.subplots_adjust(bottom=0.5)
    g.ax_heatmap.set_facecolor("gray")


plt.tight_layout()
plt.show()

The result: Resulting Image

runDOSrun
  • 10,359
  • 7
  • 47
  • 57