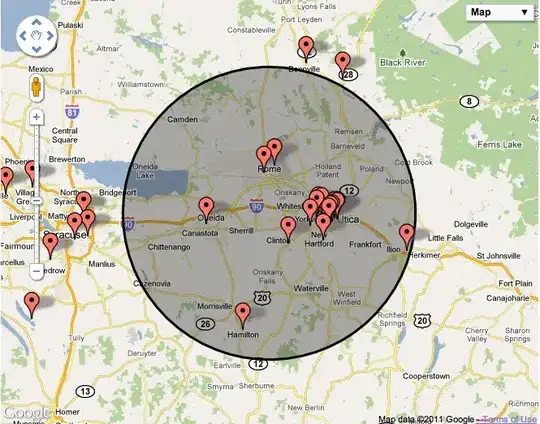
Creating a leaflet map in R can be tricky if one wants to add reactive, or otherwise customized, features. My goal was to use my workflow in R to make a choropleth map that is then augmented by the ability to click a polygon and 'reveal' a set of points.
A similar question was asked and answered in another post, but it is completely done in leaflet.js. Converting this solution to something that can be done from within R but without shiny is not as straight forward. I know it will involve using htmlwidgets::onRender() and some JavaScript knowledge.
Here is a reprex of a basic plot to add 'reactive' points to:
# Load libraries
library(sf)
library(leaflet)

# Grab data sample from the sf package for mapping
nc <- st_read(system.file("shape/nc.shp", package="sf"))

# Set a basic palette
pal <- colorNumeric("viridis", NULL)

# Create the leaflet widget with R code
nc_map <- leaflet() %>%
  addProviderTiles(providers$CartoDB.Positron) %>% # To get city names
  addPolygons(data = nc,
              fillColor = ~pal(AREA),
              color = 'grey',
              opacity = 1,
              layerId = ~CNTY_ID,
              group = 'Municipality',
              fillOpacity = 0.65,
              weight = 1.5,
              dashArray = '3',
              smoothFactor = 1,
              highlight = highlightOptions( # Make highlight pop out
                weight = 3.5,
                color = '#666',
                dashArray = "",
                fillOpacity = 0.5,
                bringToFront = T),
              popup = ~NAME,
              popupOptions = popupOptions(
                style = list('font-weight' = 'normal', padding = '3px 8px'),
                textsize = '15px',
                maxWidght = 200,
                maxHeight = 250,
                direction = 'auto')) %>%
  addLegend(data = nc, pal = pal, values = ~AREA,
            opacity = 0.7,
            title = 'Area of county',
            position = "bottomleft")

