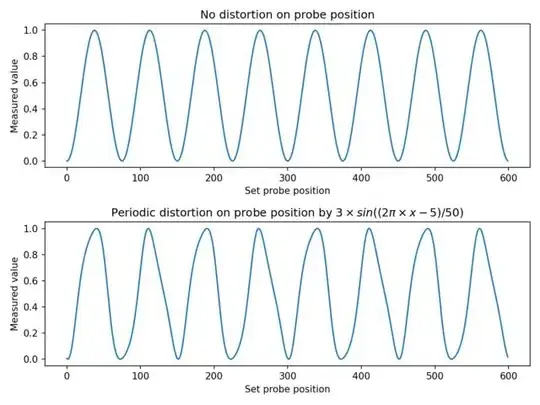
Let's say we have a measurement tool that, as a function of a probing position, returns a periodically changing value (in my case this is an atomic lattice in an electron microscope). Probing evenly in a line over a number of positions might return something like what we see on the top figure below.
Now, let's introduce a periodic scan distortion that follows a sinusoidal pattern. The actual probe position is now periodically a little off with each new position, according to some fixed strength, frequency and shift. This could look like what's seen in the second image. The plots I'm providing here for clarity have a shorter period than what I typically observe on real data. Real example below.
This situation could be generated by the following code (with image generation here), and represented in the lower plot below.
import numpy as np
import matplotlib.pyplot as plt

N = 600
probe_positions = np.arange(N)
def probe_function(probe_positions):
    return np.sin(2*np.pi*probe_positions / 150)**2

strength = 3
period = 50
shift = 5
disturbance = strength*np.sin((probe_positions - shift)*2*np.pi/period)
disturbed_probe_positions = probe_positions + disturbance
Does there exist a way to transform the measured spectrum into the original spectrum, given some known strength, frequency and phase shift of the distortion? I think I am looking for some sort of sinusoidal transform function that interpolates the values based on their neighbours, according to given strength, frequency and shift.
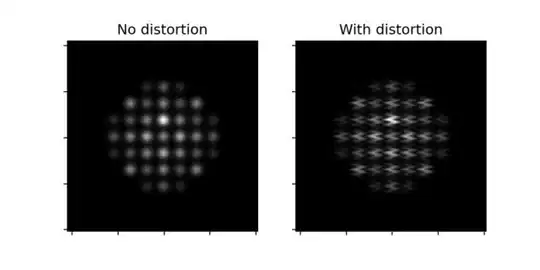
To add some further details, the following simulated distorted electron microscope nanoparticle image (right) is an example of what we might observe on a system with heavy distortion. This sort of image is generated by scanning in a "flyback" fashion, where one scans a beam that generates a pixel intensity. It starts in the top left corner, scans across the row until the end, and then repeats from the start of the next row. What I am hoping to achieve, is to try various transforms (with some knowledge about likely frequencies) to remove the distortion on the image to make it like the left image.

