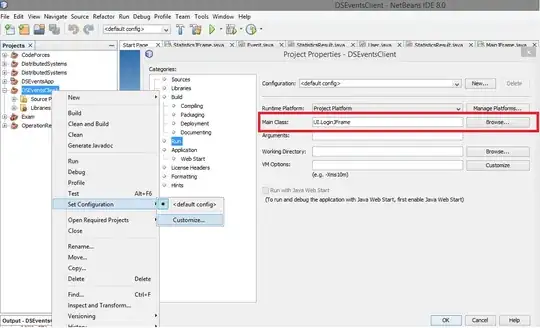
Using the following script, how can I add a bottom legend box like the image bellow?
start <- c('2002 Q1', '2008 Q4')
end <- c('2003 Q3', '2011 Q2')

dates <- as.yearqtr(seq(as.Date('2002-01-01'), as.Date('2019-06-01'), by='quarter'))

cod <- tibble(start = as.yearqtr(start), end = as.yearqtr(end)) %>%
  filter(start %in% dates) %>%
  mutate(start = as.Date(start)) %>%
  mutate(end = as.Date(end))

dates <- as.Date(dates)

tbl_fz <- tibble(x = dates, fz = 0.5)

plot <- ggplot(data = tbl_fz) +
  geom_rect(data = cod, aes(xmin = start, xmax = end,
                            ymin = 0, ymax = 1, fill = "b"), alpha = 0.9) +
  geom_line(aes(x = x, y = fz), size = 0.5) +
  ggtitle('') +
  theme_classic() +
  theme(title = element_text(size = 8),
        plot.title = element_text(hjust = 0.5),
        legend.position = c(0.5, -0.5)) +
  ylab('') +
  xlab('') +
  scale_x_date(date_breaks = '2 year', date_labels = '%Y',
               expand = c(0, 0)) +
  scale_y_continuous(expand = c(0,0)) +
  scale_fill_manual(name = 'kkkk',
                    values = c('grey'),
                    labels = c('kkkk'))

plot

