Problem:
I have fitted a general linear model (glm) with a categorical variable of the month using the function monthglm() based on the covariates of Month and Season, which was written by Barnett, A.G., Dobson, A.J. (2010) Analysing Seasonal Health Data. Springer.
The covariates 'Month' and 'Season' appear to confuse the model. From looking at the model summary (see below), there are some warning “Coefficients: (3 not defined because of singularities)”, and therefore, there are exactly three months that have not been properly estimated (e.g. March, September, and December), and instead, the model output shows NA's. So essentially the model can’t distinguish between the covariates Month and Season because they are so similar.
I was wondering if anyone can please help in regards to manipulating the data or the model itself so the function monthglm() is able to calculate the mean values and upper and lower confidence levels for all blue whale sightings over all months while including the covariates 'Month' and 'Season' in the model? As a result, the plotted model (see below) has three missing confidence bars for March, September, and December.
Aim
To plot the results of the model displaying all months between January-December showing mean blue whale sightings with both upper and lower confidence levels using the covariates 'Month' and 'Season'.
Thank you if anyone is able to help!
Function: monthglm():
     ##Install pacakages

     library(season)
     library(MASS) # for mvrnorm
     library(survival) # for coxph
     library(ggplot2)

    ##R-code for the function monthglm2()


    monthglm2<-function(formula,data,family=gaussian(),refmonth=1,
                       monthvar='month',offsetmonth=FALSE,offsetpop=NULL){
      ## checks
      if (refmonth<1|refmonth>12){stop("Reference month must be between 1 and 12")}
      ## original call with defaults (see amer package)
      ans <- as.list(match.call())

  frmls <- formals(deparse(ans[[1]]))
  add <- which(!(names(frmls) %in% names(ans)))
  call<-as.call(c(ans, frmls[add]))

  monthvar=with(data,get(monthvar))
  cmonthvar=class(monthvar)
  ## If month is a character, create the numbers
  if(cmonthvar%in%c('factor','character')){
    if(cmonthvar=='character'){
      if(max(nchar(monthvar))==3){mlevels=substr(month.name,1,3)}else{mlevels=month.name}
      monthvar=factor(monthvar,levels=mlevels)
    }
    months=as.numeric(monthvar)
    data$month=months # add to data for flagleap
    months=as.factor(months)
    levels(months)[months]<-month.abb[months]
    months<-relevel(months,ref=month.abb[refmonth]) # set reference month ### TYPO HERE, changed from months.u
  }
  ## Transform month numbers to names
  if(cmonthvar%in%c('integer','numeric')){
    months.u<-as.factor(monthvar)
    nums<-as.numeric(nochars(levels(months.u))) # Month numbers
    levels(months.u)[nums]<-month.abb[nums]
    months<-relevel(months.u,ref=month.abb[refmonth]) # set reference month
  }
  ## prepare data/formula
  parts<-paste(formula)
  f<-as.formula(paste(parts[2],parts[1],parts[3:length(formula)],'+months'))
  dep<-parts[2] # dependent variable
  days<-flagleap(data=data,report=FALSE,matchin=T) # get the number of days in each month
  l<-nrow(data)
  if(is.null(offsetpop)==FALSE){poff=with(data,eval(offsetpop))} else{poff=rep(1,l)} #
  if(offsetmonth==TRUE){moff=days$ndaysmonth/(365.25/12)} else{moff=rep(1,l)} # days per month divided by average month length
  ###  data$off<-log(poff*moff)
  off<-log(poff*moff)  #
  fit<-glm(formula=f,data=data,family=family,offset=off)
  ## return
  toret<-list()
  toret$call<-call
  toret$glm<-fit
  toret$fitted.values<-fitted(fit)
  toret$residuals<-residuals(fit)
  class(toret)<-'monthglm'
  return(toret)
}
Model
Sightings$year <- Sightings$Year

model<-monthglm2(formula=Frequency_Blue_Whales_Year_Month~Year+Season, family=poisson(),
                offsetmonth=TRUE, monthvar='Month', refmonth=1, data=Sightings)
Model Output
Call:  glm(formula = f, family = family, data = data, offset = off)

Coefficients:
 (Intercept)          Year  SeasonSpring  SeasonSummer  Seasonwinter  SeasonWinter     monthsFeb     monthsMar     monthsApr     monthsMay
  -323.25725       0.16196       0.43926      -0.03365       0.76373       0.91534      -0.06261            NA      -0.23382       0.27876
   monthsJun     monthsJul     monthsAug     monthsSep     monthsOct     monthsNov     monthsDec
    -1.97313     -19.55938       0.25231      -1.94416       0.00643       0.77171            NA

Degrees of Freedom: 35 Total (i.e. Null);  21 Residual
Null Deviance:      940.7
Residual Deviance: 195.4    AIC: 386.7
summary(model)
Number of observations = 36
Rate ratios
                  mean      lower     upper      zvalue       pvalue
monthsFeb 9.393137e-01 0.67978181 1.2979315 -0.37944839 7.043549e-01
monthsApr 7.915059e-01 0.54509500 1.1493073 -1.22869325 2.191868e-01
monthsMay 1.321488e+00 0.83554494 2.0900500  1.19180025 2.333396e-01
monthsJun 1.390209e-01 0.03860611 0.5006151 -3.01844013 2.540796e-03
monthsJul 3.202360e-09 0.00000000       Inf -0.01615812 9.871082e-01
monthsAug 1.286991e+00 1.01676543 1.6290337  2.09823277 3.588459e-02
monthsSep 1.431068e-01 0.05831898 0.3511647 -4.24489759 2.186933e-05
monthsOct 1.006450e+00 0.73231254 1.3832102  0.03963081 9.683875e-01
monthsNov 2.163470e+00 1.64625758 2.8431777  5.53616916 3.091590e-08
Plot
plot(model, ylim=c(0,1.4))
Error message inserting the y-labels and x-labels
##I am also unable to plot the x-labels and the y-labels

plot(model,
+      ylim=c(0,1.4),
+ ylab="Mean Blue Whale Sightings",
+ xlab="Month")
Error in plot.default(order, toplot$mean, xaxt = "n", xlab = "", ylab = "",  :
  formal argument "xlab" matched by multiple actual arguments
Plotted Figure
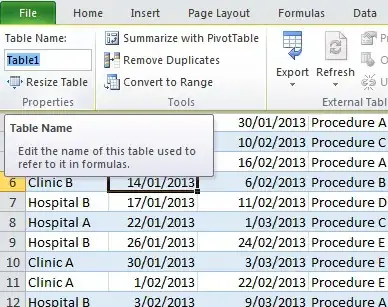
Dataframe (called Sightings)
    structure(list(Year = c(2015L, 2016L, 2017L, 2015L, 2016L, 2017L,
2015L, 2016L, 2017L, 2015L, 2016L, 2017L, 2015L, 2016L, 2017L,
2015L, 2016L, 2017L, 2015L, 2016L, 2017L, 2015L, 2016L, 2017L,
2015L, 2016L, 2017L, 2015L, 2016L, 2017L, 2015L, 2016L, 2017L,
2015L, 2016L, 2017L), Month = structure(c(5L, 5L, 5L, 4L, 4L,
4L, 8L, 8L, 8L, 1L, 1L, 1L, 9L, 9L, 9L, 7L, 7L, 7L, 6L, 6L, 6L,
2L, 2L, 2L, 12L, 12L, 12L, 11L, 11L, 11L, 10L, 10L, 10L, 3L,
3L, 3L), .Label = c("April", "August", "December", "Feb", "Jan",
"July", "June", "Mar", "May", "November", "October", "September"
), class = "factor"), Frequency_Blue_Whales_Year_Month = c(76L,
78L, 66L, 28L, 54L, 37L, 39L, 31L, 88L, 46L, 23L, 54L, 5L, 8L,
0L, 0L, 0L, 0L, 0L, 4L, 7L, 22L, 6L, 44L, 10L, 30L, 35L, 88L,
41L, 35L, 4L, 30L, 43L, 65L, 43L, 90L), Season = structure(c(4L,
4L, 4L, 4L, 4L, 2L, 2L, 2L, 2L, 2L, 2L, 2L, 2L, 1L, 1L, 1L, 1L,
1L, 1L, 1L, 1L, 3L, 3L, 3L, 3L, 3L, 3L, 3L, 3L, 3L, 3L, 3L, 3L,
5L, 5L, 5L), .Label = c("Autumn", "Spring", "Summer", "winter",
"Winter"), class = "factor")), class = "data.frame", row.names = c(NA,
-36L))
