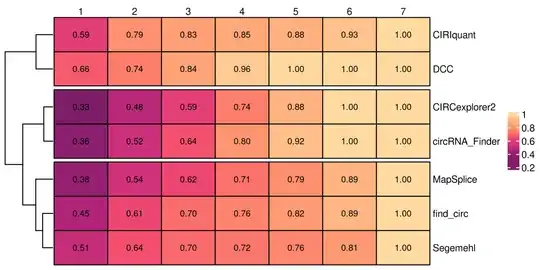
I am using PHEATMAP to generate a heatmap - currently the row names and column names defaults to left and bottom - can somebody point me to option where i can change it to RIGHT and TOP.
Asked
Active
Viewed 2,391 times
2
-
It might be easier to use a package that exposes that option than to try to achieve this with pheatmap - e.g. using ComplexHeatmap for that (https://jokergoo.github.io/ComplexHeatmap-reference/book/heatmap-annotations.html) – user12728748 Aug 06 '20 at 19:47
-
I agree - i know complex heatmap is so easy in achieving this, the problem is that i am using powerbi to load this Heatmap to read into my powerapp. Currently powerbi doesn't support complex heatmap. – Neo Aug 06 '20 at 19:58
2 Answers
0
You can reverse the order of rows and columns as follows:
library(pheatmap)
library(gridExtra)
# Heatmap of the original data set
p1 <- pheatmap(mtcars, cluster_cols=F, cluster_rows=F)

# Heatmap of the data set with flipped rows and columns
mtcars2 <- mtcars[nrow(mtcars):1, ncol(mtcars):1]
p2 <- pheatmap(mtcars2, cluster_cols=F, cluster_rows=F)

grid.arrange(grobs=list(p1$gtable,p2$gtable), nrow=1)
Marco Sandri
- 23,289
- 7
- 54
- 58
-
1Thanks Marco - This would be helpful as well. I am looking at moving the location of the column labels to the top of the chart and row labels to the left of the chart. – Neo Aug 13 '20 at 13:30
-
0
Unfortunately, you must use ComplexHeatmap - I'm aware OP cannot use CH but posterity for others:
library(pheatmap)
pheatmap(plot_mat, cluster_rows = T, cluster_cols = F,
         display_numbers = T, cutree_rows = 3,
         color = hcl.colors(50, "sunsetdark", rev=F),
         border_color = "black", number_color = "black",
         fontsize_number = 9, angle_col = 0)
library(ComplexHeatmap)
ComplexHeatmap::pheatmap(plot_mat, cluster_rows = T, cluster_cols = F,
                         display_numbers = T, cutree_rows = 3,
                         color = hcl.colors(50, "sunsetdark", rev=F),
                         border_color = "black", number_color = "black",
                         fontsize_number = 9, column_names_side = c("top"),
                         angle_col = c("0"))
Barry D
- 43
- 1
- 6


