Here's my take on this. Find something in common on all the sheets, loop through each sheet, perform a common/standardized operation on each sheet.
Sub Macro1()

Dim rs As Worksheet

For Each rs In ThisWorkbook.Worksheets
rs.Select

   If rs.Name <> "Unemployment" Then
        Columns("B:D").Select
        Range("B5").Activate
        ActiveSheet.Shapes.AddChart2(227, xlLine).Select
        ActiveChart.SetSourceData Source:=Range(rs.Name & "!$B:$D")
        ActiveChart.ChartType = xlColumnClustered
        ActiveChart.FullSeriesCollection(1).ChartType = xlColumnClustered
        ActiveChart.FullSeriesCollection(1).AxisGroup = 1
        ActiveChart.FullSeriesCollection(2).ChartType = xlLine
        ActiveChart.FullSeriesCollection(2).AxisGroup = 1
        ActiveChart.FullSeriesCollection(1).AxisGroup = 2
        ActiveChart.FullSeriesCollection(1).ChartType = xlLine
   End If

Next rs

End Sub
Notice, I am skipping the first sheet, named 'Unemployment' because this sheet is different than all the others. Also, the code between the If...End If is simply a recorded macro. If it doesn't do exactly what you want, record a macro to do what you want, and copy/paste that code between the If...End If.
Let me know if you have any questions.
Based on your most recent question, here are my findings.
#1) In the workbook named 'GDP_Annual_Growth_Rate', you actually have a space after the tab named 'GDP Annual %' so the actual name is 'GDP Annual % '. I don't think you want that!
#2) You had to close your Sub with 'End Sub'. You ALWAYS need an 'End Sub' at the end.
#3) As you start to loop through the sheets, you start to slect charts and make modifications to those charts, like this: 'ActiveSheet.ChartObjects("Chart 1").Activate'. But, what if you don't have a chart on one sheet, you can't select a chart if it doesn't exist.
#4) Finally, rs sound like a records set in MS Access; that's my take on it. Why not declare a Worksheet as ws: 'Dim ws As Worksheet'
Here's some working code to get you started.
Sub DeleteallCharts()
Dim chtObj As ChartObject
Dim ws As Worksheet
For Each ws In ThisWorkbook.Worksheets
ws.Select
    For Each chtObj In ActiveSheet.ChartObjects
    chtObj.Delete
    Next
Next ws
End Sub


Sub BuildAllCharts()

Dim ws As Worksheet

For Each ws In ThisWorkbook.Worksheets
ws.Select

    If ws.Name <> "GDP Annual %" And ws.Name <> "Navigation" Then

        Range("A:A,E:E").Select
        Range("" & ws.Name & "[[#Headers],[12 Mth Rolling Avg.]]").Activate
        ActiveSheet.Shapes.AddChart2(227, xlColumnClustered).Select
        ActiveChart.SetSourceData Source:=Range("" & ws.Name & "!$A:$A," & ws.Name & "!$E:$E")
        ActiveChart.FullSeriesCollection(1).Select
        With Selection.Format.Fill
            .Visible = msoTrue
            .ForeColor.RGB = RGB(255, 0, 0)
            .Transparency = 0
            .Solid
        End With
        Range("" & ws.Name & "[[#Headers],[Country]]").Select

    End If

Next ws

End Sub
Notice: the first Macro deletes all charts and the second Macro builds all charts. The only thing that may be a bit confusing is the '& ws.Name &' but you need this as you loop through all sheets, so you get dynamic references to each relative data set on each sheet. Record a Macro yourself, and you will see hot it is linked to one specific sheet.
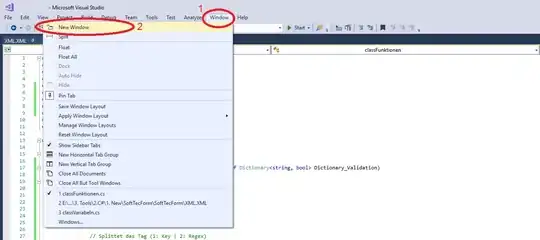
Finally...if you want to create a Secondary Axis, follow the steps below.
Select a chart to open Chart Tools.

Select Design > Change Chart Type.

Select Combo > Cluster Column - Line on Secondary Axis.

Select Secondary Axis for the data series you want to show.

Select the drop-down arrow and choose Line.

Select OK.
I just created a sample for you, below. You exact requirement may be slightly different, but this should illustrate the point.

Here is a link for some really, really, really cool charting ideas.
https://peltiertech.com/Excel/Charts/ChartIndex.html


