1

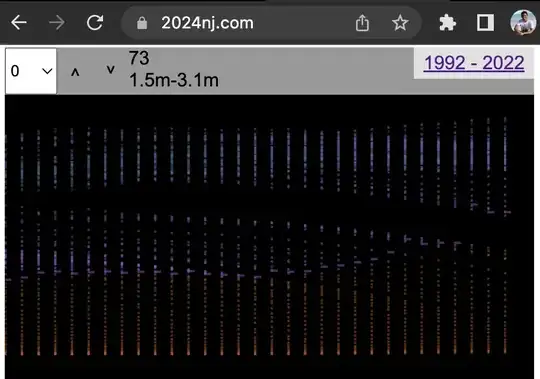
I want rename the x ticks marks with name localtimeat my graphic, which is "POSIXct" "POSIXt"

My original localtime is in Portuguese, and I want to rename to English

Dez = December

Jan = January

Fev = February

Mar = March

ps: I can't make an real example to have the similar result of plot because have more than 2000 localtimes.

dt = data.table(localtime= as.POSIXct(c("2016-10-24 12:45:06", "2016-10-24 12:46:13", "2016-10-24 12:47:02", "2016-10-24 12:48:27", "2016-10-24 12:52:39", "2016-10-24 12:55:11", "2016-10-30 21:08:02", "2016-10-30 21:18:27", "2016-10-30 21:30:13","2016-10-24 23:27:21", "2016-10-26 06:54:29")),
depth_range = c("shallow", "deep"),
dmean = c(30, 50, 200, 76, 467, 87, 98, 10, 240, 176, 89))

ggplot(dt, aes( x=localtime, xend= localtime, y=0, yend= dmean, color=depth_range))+
  geom_segment( size=1)+
  scale_colour_manual(name = "Dive category", values = c("grey70", "orangered3")) +
  scale_y_reverse()+
  xlab("Time")+
  ylab ("Dive depth (m)")+
  ggtitle("Whale ID 172001_17")+
  theme_bw()

The real plot of my data

And I tried somethings:

scale_x_discrete(labels=c("Dez"="December","Jan"="January", "Fev"="February", "Mar"= "March"))

scale_x_discrete(labels = c("December", "January", "February", "March"))

scale_x_discrete(breaks=c("Dez", "Jan", "Fev", "Mar"),
          labels=c("December", "January", "February", "March"))

scale_x_continuous(breaks=c("Dez", "Jan", "Fev", "Mar"),
                 labels=c("December", "January", "February", "March"))  

scale_x_continuous (names= c("December", "January", "February", "March"))

leg2<- c("December", "January", "February", "March")
scale_x_continuous(labels = leg2)

leg2<- c("December", "January", "February", "March")
scale_x_discrete(labels= leg2)

theme(axis.text.x = c("December", "January", "February", "March"))

theme(axis.text.x = element_text("December", "January", "February", "March"))

#I tried too to convert localtime to factor, but the plot didn't work well
ggplot(dt, aes( x=factor(localtime), xend= factor(localtime), y=0, yend= dmean, color=depth_range))+

Shows that error:

Erro: mapped_discrete objects can only be created from numeric vectors

How can I fix this??
  • Try `+ scale_x_datetime(date_labels="%b")`, it'll label every tick with just the short month abbreviation. This will repeat month labels when the x span is short (as in this example), so other options to `scale_x_datetime` allow you to specify where to place the ticks (`breaks=` or `date_breaks=`). – r2evans Jul 30 '20 at 16:37
  • but the problem is because my original data is in Portuguese, and I want to rename to English. I edited the post – Érika Soares Coelho Jul 30 '20 at 16:39
  • One of: (1) use `scale_x_datetime(breaks=..., labels=...)`; or (2) look at `Sys.getlocale()` (in order to save the current value), then `Sys.setlocale("LC_ALL", "English")` and try the plot. (Then you may want to set it back to what it was before.) I've seen others suggest `Sys.setenv(LANG="English")`, not sure if it will affect this. – r2evans Jul 30 '20 at 16:45
  • the (1) and (3) didn't rename... the (2) shows: `Warning message: In Sys.setlocale ("LC_ALL", "English"): SO informs that the request to define the locale as 'English' cannot be honored` – Érika Soares Coelho Jul 30 '20 at 16:53
  • Try `Sys.setlocale(locale="English_United States.1252")` (gathered from my answer). – r2evans Jul 30 '20 at 16:55

1 Answers1

1

I'm already in English, so I'll demonstrate by plotting into Portugeuse :-)

First, I'll save my current locale, because I don't speak Portuguese and sometimes R's errors can be confusing enough in my own language:

Sys.getlocale()
# [1] "LC_COLLATE=English_United States.1252;LC_CTYPE=English_United States.1252;LC_MONETARY=English_United States.1252;LC_NUMERIC=C;LC_TIME=English_United States.1252"
Sys.setlocale(locale="Portuguese")
# [1] "LC_COLLATE=Portuguese_Brazil.1252;LC_CTYPE=Portuguese_Brazil.1252;LC_MONETARY=Portuguese_Brazil.1252;LC_NUMERIC=C;LC_TIME=Portuguese_Brazil.1252"

Now, I plot, adding scale_x_datetime:

ggplot(dt, aes( x=localtime, xend= localtime, y=0, yend= dmean, color=depth_range))+
  geom_segment( size=1)+
  scale_colour_manual(name = "Dive category", values = c("grey70", "orangered3")) +
  scale_y_reverse()+
  xlab("Time")+
  ylab ("Dive depth (m)")+
  ggtitle("Whale ID 172001_17")+
  theme_bw() +
  scale_x_datetime(date_labels = "%b %d")

I included "%d" because your sample data only spanned a few days; you should be able to use just "%b" (determined by ?strptime).

Note: this highlights one possibly flaw: ggplot2 doesn't know that the labelling format "%b" is no more resolute than "1 month", so if I don't include %d (day of month) in the format, ggplot2 will happily show out out out on the x-axis. In your real data, this might not be a problem. You can play with other options such as date_breaks="1 month" to make sure that the x axis ticks are no more frequent than 1 month ... but using that here results in no ticks, since I believe it is defaulting to the first of the month and this sample has nothing on that date. You may need to hard-code breaks= in your scale call in order to fix where they go, and/or use a function for breaks to control where the breaks go.

plot with Portuguese months

r2evans
  • 141,215
  • 6
  • 77
  • 149