9

I'm trying to debug an Apps Script project, and for the past 2–3 days, the debugger hasn't let me look at variables defined at the scope level.

For example, I was trying to debug this code.

/**
 * Deletes all rows in a sheet, excluding header rows. Just calling sheet.deleteRows() 
 * for a massive range of rows will throw out an error.
 * @private
 * 
 * @param {Sheet} sheet 
 * @param {number = 0} numHeaderRows 
 * @param {number = 500} deletionSize - The number of rows to delete at a time
 */
function deleteAllNonHeaderRows_(sheet, numHeaderRows = 0, deletionSize = 500) {
  const startingNumberOfRows = sheet.getMaxRows();
  for (let numRows = startingNumberOfRows; numRows > numHeaderRows; numRows -= deletionSize) {
    if (numRows < deletionSize) {
      const deletionArgs = [numHeaderRows + 1, sheet.getLastRow() - numHeaderRows]
      sheet.deleteRows(...deletionArgs);
    } else {
      sheet.deleteRows(numRows - deletionSize, deletionSize);
    }
  }
}

It normally would have been a quick process, but since I couldn't look at the value of the arguments I was trying to pass into sheet.deleteRows(), it took me a moment to tell that I should have used sheet.getMaxRows() instead of sheet.getLastRow(). Using the debugger brings up a menu that lists all the scopes, but trying to expand the block scopes doesn't do anything. After some tinkering, I found that this problem extends to everything implemented as an object, so arrays are included, too. Expanding local scopes works, but if any kind of object is in there, I can't expand it.
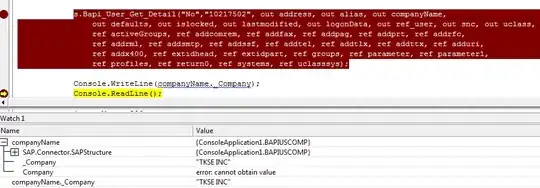
Image linked because this is my first post, and I can't embed yet

I'm not sure what could be causing this problem. I was coding in Edge, but switching to Chrome didn't change anything (likely because they're both Chromium-based). I've also tried disabling all my ad blockers and privacy protectors. Looking up issues other people have had didn't turn up any recent posts, either. Is there anything that can be done? I also keep occasionally getting error messages saying something like "Could not connect to server". But the scripts themselves run fine, whether they're run in the container-bound file or the editor itself.

Rubén
  • 34,714
  • 9
  • 70
  • 166
  • 1
    If you're sure it's a bug, file a issue in the tracker. See [tag info page](https://stackoverflow.com/tags/google-apps-script/info) for more details. There should be a "script" scope - that doesn't seem to be present. Maybe Google changed something recently. – TheMaster Jul 23 '20 at 16:28
  • After reading this I checked and my editor's debugger is broken as well. I do get a script scope, but I can't expand script, global, or any objects. Also, can't step through the debugger. [Here's the open issue](https://issuetracker.google.com/issues/161887507) – dwmorrin Jul 23 '20 at 16:48
  • What's the question? If you are looking for help regarding how to debug your code please improve the wording of your question but if this is something that only Google can take action on please bear in mind that features requests and bugs should be posted on the Google Apps Script issue tracker. Ref. https://developers.google.com/apps-script/guides/support/troubleshooting – Rubén Jul 23 '20 at 16:51
  • @dwmorrin Consider adding the link as a answer. – TheMaster Jul 23 '20 at 20:21

2 Answers2

9

EDIT:

This V8 debugging issue has been fixed by Google.

(as of September 1, 2020)

Original answer:

V8 debugging is currently experiencing bugs

(as of July 23, 2020)

Using the debugger results in non-responsive UI (reports vary), server responses of 409, breakpoints hang execution. Star the issue linked to below if you are experiencing similar behavior.

Link to Issue in Google's IssueTracker: "Debug mode not responsive in V8"

dwmorrin
  • 2,704
  • 8
  • 17
2

What you can do for now while this bug exists is click "Run->Disable new App Scripts runtime"

That will get the debugger working again but it will obviously disable any new features in the V8 runtime. If you have a simple script it probably won't affect much.

Alex
  • 460
  • 1
  • 5
  • 16
  • Just switched to V8 on 8/29/20 and unfortunately the debugger is still experiencing bugs. Thanks for the tip on how to disable it. – knurmia Aug 31 '20 at 17:52