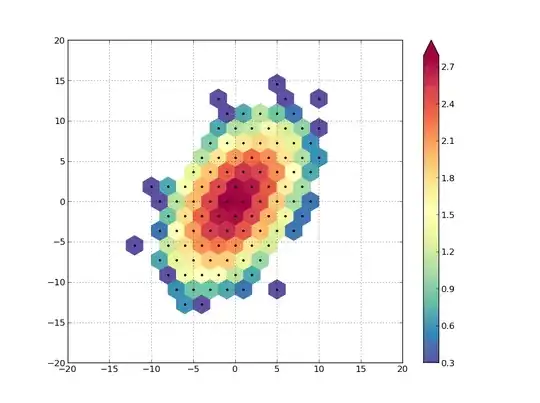
I am using Chart.js ver: 2.9.3. I am using custom tooltip to show up on the click of the bubble type dataset. Please refer below image:
 Now, I want to unhighlight (make inactive) all the bubbles programatically on the click of the button.
Can anybody please help me with this?
Chartjs: How to programatically remove (unhighlight or make inactive) all the active points on chart
Asked
Active
Viewed 238 times
0
Rahul Gupta
- 9,775
- 7
- 56
- 69
-
Please share the code or a jsfiddle showing the issue. What have you tried? What is not working? – Jens Stragier Jul 17 '20 at 12:20
1 Answers
0
As show in the code snippet below, I used update method of the chart to rerender the chart after I set empty array for the active property of the chart.
JS:
var myChart = new Chart(ctx, {
  ....
  .....
});

function setInactiveAllPoints() {
  myChart.active = [];
  myChart.update();
}
HTML:
<button onclick="setInactiveAllPoints()">Set Inactive All Points On Chart</button>
Rahul Gupta
- 9,775
- 7
- 56
- 69