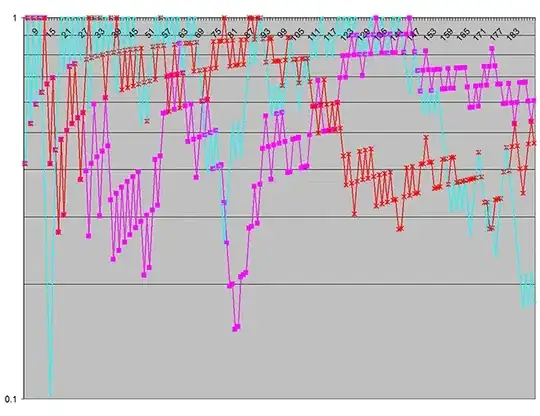
I am new to R and I am trying to plot multiple CUSUM charts in one display. I have tried par(mfrow=c(2,1)), layout(), cowplot() and it did not work.
The function mentioned does makes the 1st CUSUM chart smaller and be plotted like normal plot(); successfully plotted 1st CUSUM at top half. However, the 2nd CUSUM chart just refreshes the display automatically instead of being plot below the 1st chart in the same display. Any solution or just possible solution is welcomed, many thanks in advance.
To be clear, I am not talking about plotting 'cumsum' data but CUSUM charts with the cusum() function like the following: cusum(data, std.dev = standard_deviation_of_data, center = center, add.stats=FALSE, xlab="Studies", title="CUSUM chart", labels=labels)
