I have a time series that I obtain from a numerical simulation with an integration time step of 1min. This time series spans several months and I want to use dates in the x-axis. Once the integration is over I add an epoch time corresponding with the first day to the time numpy array created as
tt = np.arange(0.0, number_of_days, minute)
I only pick up data points every 10 mins (tt[::10]).
I convert this array to the date format '%Y-%m-%d %H:%M:%S' via
dtime = np.empty(len(tt[::10]), dtype="S19")
for ind, t in enumerate(tt[::10]):
   daytime = time.strftime('%Y-%m-%d %H:%M:%S', time.localtime(t))
   dtime[ind] = datetime.strptime(daytime, '%Y-%m-%d %H:%M:%S')
print(dtime) results in:
[b'2020-01-22 00:00:00' b'2020-01-22 00:10:00' b'2020-01-22 00:20:00' ...
 b'2020-06-29 23:30:00' b'2020-06-29 23:40:00' b'2020-06-29 23:50:00']
I format the xticks as:
plt.gca().xaxis.set_major_formatter(mdates.DateFormatter('%Y-%m-%d'))
plt.gca().xaxis.set_major_locator(mdates.WeekdayLocator())
plt.gca().xaxis.set_minor_locator(mdates.DayLocator())
I plot this data with:
plt.plot_date(dtime, Y)
plt.gcf().autofmt_xdate()
I get the same result if I only use plt.plot.
I get no xticks with the dates unfortunately.
It seems dates are not properly formatted in datetime format so that matplotlib understands it. I suspect the problem has to do with dtime, which I think should not be of string type.
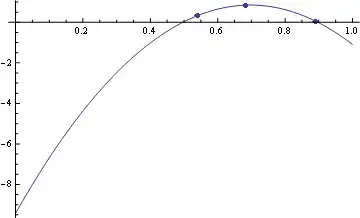
The result is
I would like to plot this time series with this graph, which has one data point per day.
I have a second related question here: how to set the major ticks at biweekly intervals?
When I plot both datasets together I get this:

Update: Based on the solution proposed by Andrea, I can now plot both datasets in the same graph as below


