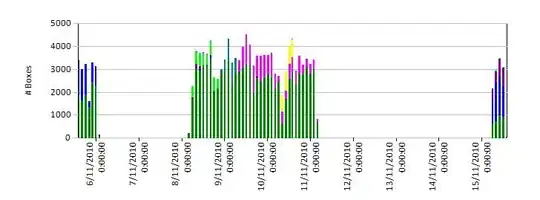
I would like to ask a help in modify axes in control chart in RStudio, by qcc package.
Generated a controlchart type EWMA, in the axes x, appear group, sequencially (that represents each observations), but I need insert an information about year (divide group into sequence of year). I tried using the command (axes), but doesn't work.
Which command or function it is possible to modify to achieve this?
Thank you very for help!

Yours faithfully
Guilherme
