0
ggplot(data=df, aes(x='Matcing_Probability', y=Locus_Name, group=1)) + 
+     geom_line(color="#aa0022", size=1.75) + 
+     geom_point(color="#aa0022", size=3.5) 

enter image description here

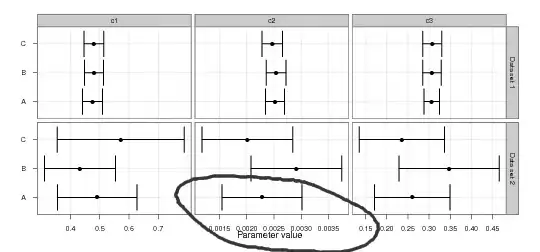
This is the graph I am getting from the code.

Martin Gal
  • 16,640
  • 5
  • 21
  • 39
  • Welcome to Stack Overflow. It's easier to help you if you make your question reproducible including sample input and expected output that can be used to test and verify possible solutions Check out [mre] and [ask]. Please don’t use images of code or data as they cannot be used without a lot of unnecessary effort. – Peter Jun 23 '20 at 16:49

1 Answers1

0

You need to send ggplot2 symbols (unquoted column names) in aes() if you are assigning an aesthetic to a column in your dataset. Otherwise, it will assume you are sending the string of a new symbol. So:

# your original
ggplot(data=df, aes(x='Matching_Probability', y=Locus_Name, group=1))

# change to this:
ggplot(data=df, aes(x=Matching_Probability, y=Locus_Name, group=1))

Consider the difference in the following example to highlight why even more:

# this works fine
df <- data.frame(x=1:10, y=1:10)
ggplot(df, aes(x=x,y=y)) + geom_point()

enter image description here

# this doesn't:
ggplot(df, aes(x="x",y=y)) + geom_point()

enter image description here

chemdork123
  • 12,369
  • 2
  • 16
  • 32
  • Hello @chemdork123 thank you for your response. It worked fine with your help. I want to ask another question that ii. Can I add more than one column in the same plot and if so from above table i would like to take multiple columns together. – Prakhar Sonik Jun 24 '20 at 17:25
  • I would suggest asking a separate question, although you will likely find the answer to that question already on SO. So you are saying you have data with columns for x, y1, and y2, and you want to plot two series of points: y1 and y2 on the same y axis? Very straightforward by using `gather()` from `dplyr` or `pivot_longer()` to reformat your data so that you have columns for x, y, and type_of_y. Then you would plot: `ggplot(df, (aes(x,y)) + geom_point(aes(color=type_of_y))`. Does that answer that question? If not, please ask in SO and check to be sure it's not already answered elswhere. – chemdork123 Jun 24 '20 at 18:22