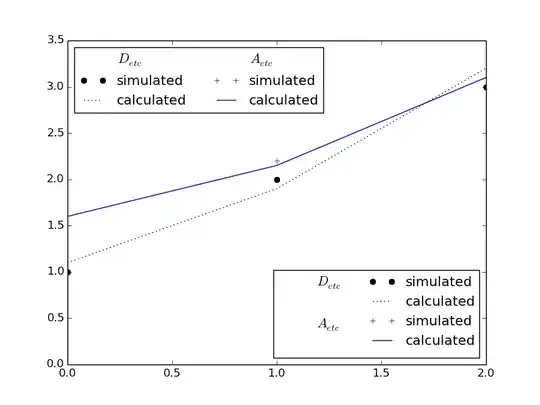
I hope you all are fine.
I got a function (Y axis) that gets values according to a datetime pandas array (X axis) as shown below.
I need to get all the maximum values. Those n maximum values depends on the number of days that are between a start and end pd.timestamp. Then, I also need to save those values in an array; something like this:
max_values = [
    (A_value_1, B_value_1),
    (A_value_2, B_value_1),
        ...,
    (A_value_n, A_value_n)]
Note: The B_value_#is the same that I am asking for but with another function (A_values: Irradiance and B_values: Cell temperature, just a contextualization for the PVLIB-Python community.
For those who are familiar with PVLIB-Python, I am trying to get the I-V curve by using the pvsystem.calcparams_desoto function (this is because I am using a CEC module and it doesn't have the parameters required by the SAPM function. Part of this code is snipped below:
    IL, I0, Rs, Rsh, nNsVth = pvsystem.calcparams_desoto(
    effective_irrad_calc,
    pvtemps['temp_cell'],
    module['alpha_sc'],
    module['a_ref'],
    module['I_L_ref'],
    module['I_o_ref'],
    module['R_sh_ref'],
    module['R_s'],
    EgRef=1.121,
    dEgdT=-0.0002677
)

curve_info = pvsystem.singlediode(
    photocurrent=IL,
    saturation_current=I0,
    resistance_series=Rs,
    resistance_shunt=Rsh,
    nNsVth=nNsVth,
    ivcurve_pnts=100,
    method='lambertw'
)

# plot the calculated curves:
plt.figure()
for i, case in conditions.iterrows():
    label = (
        "$G_{eff}$ " + f"{case['Geff']} $W/m^2$\n"
        "$T_{cell}$ " + f"{case['Tcell']} $C$"
    )
    plt.plot(curve_info['v'][i], curve_info['i'][i], label=label)
    v_mp = curve_info['v_mp'][i]
    i_mp = curve_info['i_mp'][i]
    # mark the MPP
    plt.plot([v_mp], [i_mp], ls='', marker='o', c='k')

plt.legend(loc=(1.0, 0))
plt.xlabel('Module voltage [V]')
plt.ylabel('Module current [A]')
plt.title(parameters['Name'])
plt.show()
plt.gcf().set_tight_layout(True)
Note: This code snipped was taken at: https://github.com/pvlib/pvlib-python/blob/master/docs/examples/plot_singlediode.py
Thanks in advance. :)
