1

I am trying to figure out a way to plot EEG electrode coordinates onto a 3D image of a mouse brain, similar to this:
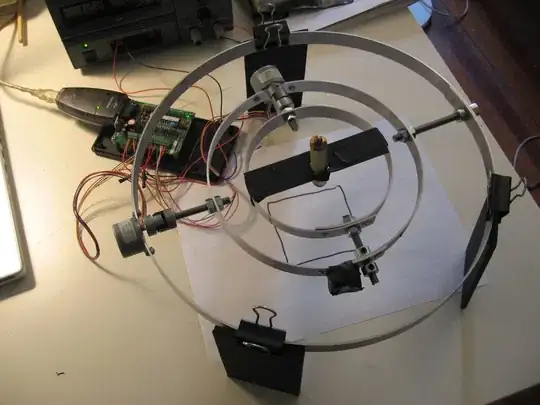
3D Human Brain with EEG electrode positions shown

Sorry there are a lot of pictures showing what's been done. I'm a bit new to python, so I'm still trying to figure out what is the most important info to share is. Please feel free to ask for more information on what I've done.

Here is what has been done so far in a Jupyter notebook:

import os
import numpy as np
import pandas as pd
import matplotlib.pyplot as plt
from matplotlib.gridspec import GridSpec
from allensdk.core.mouse_connectivity_cache import MouseConnectivityCache
%matplotlib notebook

This is how we are interacting with coordinates for the electrodes on the EEG:

coords = pd.DataFrame({'AP': channel_AP, 'ML': channel_ML})
coords.head()

Pictures showing more of what's been done: Mouse Brain Template Mouse Brain Template cont.

This is the code for how I am IDing approximately what brain region my electrodes are over:
This is the code for how I am IDing approximately what brain region my electrodes are over

Jackie
  • 33
  • 5
  • The general idea of plotting points on an image is easy, but the challenge is to make sure the points are in the right place. That is, the image has its coordinate system (usually integers where 0,0 is in a corner), and the data has a different coordinate system. The only significant challenge is mapping between these. The better you can specify how to do this map, the more likely it will be that you get a good answer. – tom10 May 06 '20 at 19:27
  • Thank you for the advice. I added more of how the brain template was generated. Do you know how I can over lay my brain map coordinate system with my EEG coordinates? – Jackie May 06 '20 at 19:48
  • I've looked at what you've posted and I don't see how there's enough information there to figure out the mapping. Maybe I'm wrong though. Overall, it seems to me that the problem is understanding your data structures, and because that's the issue, you're hoping to find someone here who understands your data structures better than you do, but unfortunately finding such a person is unlikely. – tom10 May 06 '20 at 20:17
  • Our annot array (which is creating the annotated template) is a 3D array with values identifying a brain region. So perhaps a better way to phrase my question is How do we make a 3D plot colored by brain region? – Jackie May 06 '20 at 20:30
  • Have a look at [brainrender](https://github.com/BrancoLab/BrainRender). As you have full brain scans, you can probably use [amap](https://github.com/SainsburyWellcomeCentre/amap-python) to do the registration to get the coordinates of your electrodes in brain atlas space. – Paul Brodersen May 07 '20 at 09:06
  • Thanks for the suggestion! Let me work with these for a bit and I'll let you know if it works out. – Jackie May 07 '20 at 16:22
  • I got brainrender to work okay. Still trying to find a way to get my electrodes to not be floating over the parts of the brain that are curved. – Jackie May 12 '20 at 20:36

0 Answers0