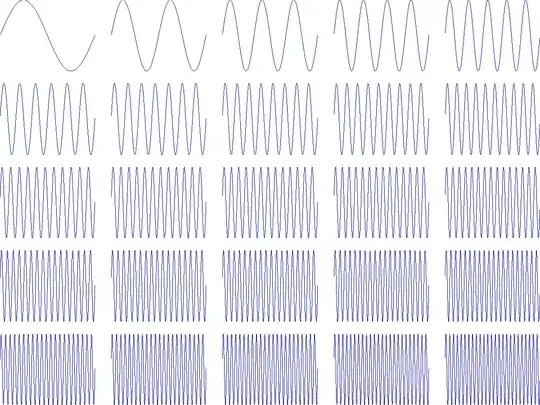
I'm trying to extract frequency information of simple 16 bit pcm wav file containing only one pure tone (750hz created with audacity) in JavaScript with nodejs.
I'm using:
- node-wav for reading the wav file
- fft.js to perfom fft operation
- nodeplotlib to finaly plot the results
Here is the code i came up with:
const wav = require('node-wav');
const FFT = require('fft.js');
const fs = require('fs');
const plotlib = require('nodeplotlib');


let size = 4096; //fft size
let fft = new FFT(size); //create fft object
let realOutput = new Array(size); // to store final result
let complexOutput = fft.createComplexArray(); // to store fft output


let buffer = fs.readFileSync('750hz.wav'); // open a 1s wav file(mono 16bit pcm file at   32000hz) containing only a 750hz sinusoidal tone
let result = wav.decode(buffer); // read wav file data
let audioData = Array.prototype.slice.call( result.channelData[0]); // convert Float32Array to normal array
realInput = audioData.slice(0,size); // use only 4096 sample from the buffer.

fft.realTransform(complexOutput, realInput); // compute fft
// fft.completeSpectrum(complexOutput);
fft.fromComplexArray(complexOutput,realOutput); // get rid of the complex value and keep only real


let x =[];
for(let i=0;i<size;i++) x.push(i); //create a simple dumb x axis for the fft plot

plotlib.plot( // plotting the input data
    [{
        x: x,
        y: realInput,
        type: 'line',
        name:'input'
    }]
);

plotlib.plot( // plotting the fft output
    [{
        x: x,
        y: realOutput,
        type: 'line',
        name:'output'
    }]
);
Plotting the input data from the code above give me:

And the output look like this:

While i was expecting to get only one spike, something like this:

- Is there something wrong with my code or the output is supposed to look like that and i missed something about how to generate frequency spectrum out of an fft?
- Can fft work with float value right away or it need to be converted to Integer first?
- Do i need the complex part of the fft output in my case?