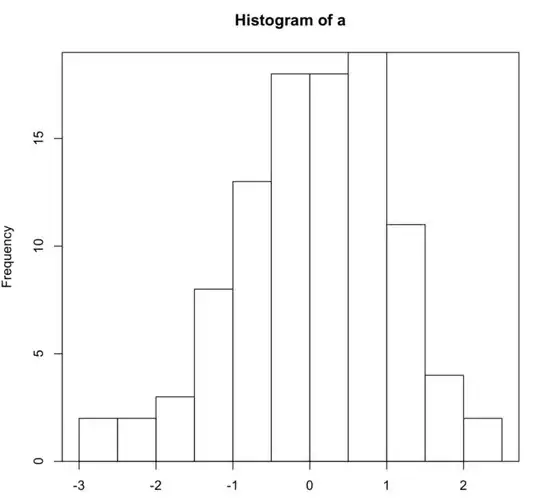
I think setting ylim mentioned by @KamranEsmaeili is a standard solution. Here I provided a tricky way that doesn't require manually setting the upper limit 40.
multhist() is based on the built-in barplot() and it always sets the lower limit of y-coordinate of the plotting region less than 0. You can use par("usr")[3] to check this fact. I just came up with a tricky method that adjusts the box type to "7" to suppress the bottom line and add a new bottom line at 0 by abline(h = 0).
library(plotrix)
set.seed(42)
a <- rnorm(100)
b <- rnorm(100) + 1
multhist(list(a,b))
#---------------------------------
box(bty = "7") # bty is one of "o"(default), "l", "7", "c", "u", and "]".
abline(h = 0)

Edit
If you don't like the right line extending beyond the x axis, then you can replace box() with rect() so that you can specify positions of four sides by yourself. Remember to add xpd = TRUE, or the line width will look thinner than y-axis.
multhist(list(a,b))
x <- par("usr")
rect(x[1], 0, x[2], x[4], xpd = TRUE)


