46

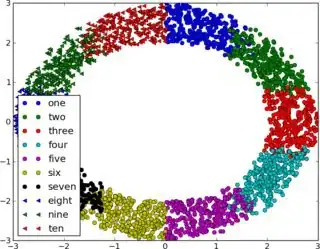
How can I create a scatter plot legend without two symbols showing up each time? I can understand why you'd want this when you're joining symbols by lines, but for a pure scatter plot, all I want in the legend is one example of the symbol. This plot from a previous stackoverflow post shows the kind of thing I mean:

enter image description here

Hooked
  • 84,485
  • 43
  • 192
  • 261
Mark W
  • 795
  • 2
  • 7
  • 9

1 Answers1

72

In the legend command you can use the scatterpoints option:

ax.legend(loc=0, scatterpoints = 1)

For a normal plot, it is the option numpoints.

Here you can find more information about the keyword arguments for the legend: http://matplotlib.sourceforge.net/api/pyplot_api.html#matplotlib.pyplot.legend

joris
  • 133,120
  • 36
  • 247
  • 202