2

I'd like to calculate the local volatility surface for a series of option strikes, similar to the surface described in this paper:

http://www.ederman.com/new/docs/gs-local_volatility_surface.pdf

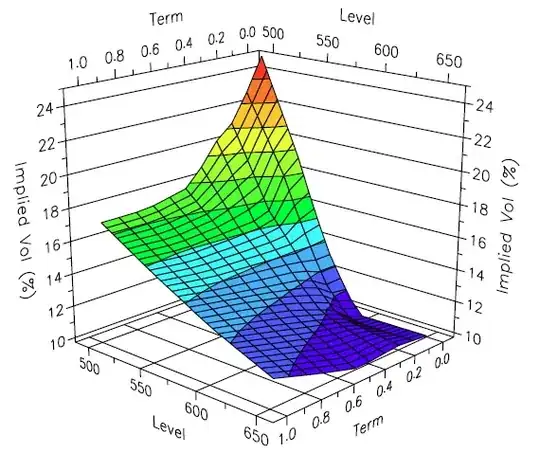
This is the image I am referring to in the aforementioned paper:

enter image description here

I know QuantLib has the ability to do this - but does anyone know the correct C# function call(s)?

I'm using the C# build of QuantLib, from: http://www.resolversystems.com/products/quantlib-binary/

Contango
  • 76,540
  • 58
  • 260
  • 305
  • I am not saying that your question is off-topic here, but please note that there's also http://quant.stackexchange.com/ – NPE May 20 '11 at 16:39
  • Good point. I've posted the question on this site as well. – Contango May 22 '11 at 00:02
  • See http://quant.stackexchange.com/questions/1195/how-to-calculate-the-local-volatility-surface-using-quantlib – Contango Oct 19 '11 at 16:15

2 Answers2

1

Answer quoted from QuantLib:

Assuming you're referring to the local-volatility class implemented in <QuantLib/ql/termstructures/volatility/equityfx/localvolsurface.hpp>, it's among the several classes that are not exported through SWIG. You'll have to add it to the SWIG interface files (probably in volatilities.i), regenerate the wrappers and recompile them. If you need instructions on the building process, you can ask on the QuantLib mailing list.

Contango
  • 76,540
  • 58
  • 260
  • 305
-5

Quantlib is not free.

I tried:

-EPPlus, which support plotting chart on Excel, but only no surface chart

-NPOI, doesn't support any charts

littlecodefarmer758
  • 968
  • 2
  • 10
  • 23