I am a newbie in JIRA World, my mission is to develop a JIRA plugin that display charts (pies, histogram, etc.). The user would choose the criteria of search and the type of charts, and the user should be able to save those charts (Word/PDF).
I don't know if I should develop a report plugin and use JFreeChart for charting or develop a charting plugin (I haven't seen any example of charting plugin). I have done some research about report plugin and I haven't found an example show how to Use JFreechart!! also I haven't found any example show how to use jasperReport (or another tool) to generate word or PDF report.
The user should access to the plugin from a tab like interface (administration, home, etc.)
Example of KPI (key performance indicator) to display:
- Average of time spent to reslove an issue
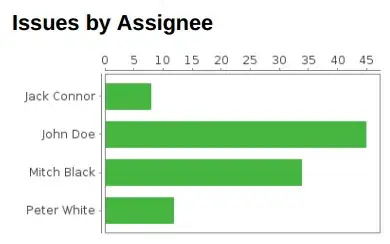
- Number of issues that still open
PS: I'm using JIRA 4.3.3