What I am trying to do is to play around with some random distribution. I don't want it to be normal. But for the time being normal is easier.
import matplotlib.pyplot as plt
from scipy.stats import norm

ws=norm.rvs(4.0, 1.5, size=100)
density, bins = np.histogram(ws, 50,normed=True, density=True)
unity_density = density / density.sum()

fig, ((ax1, ax2)) = plt.subplots(nrows=1, ncols=2, sharex=True, figsize=(12,6))
widths = bins[:-1] - bins[1:]

ax1.bar(bins[1:], unity_density, width=widths)
ax2.bar(bins[1:], unity_density.cumsum(), width=widths)

fig.tight_layout()
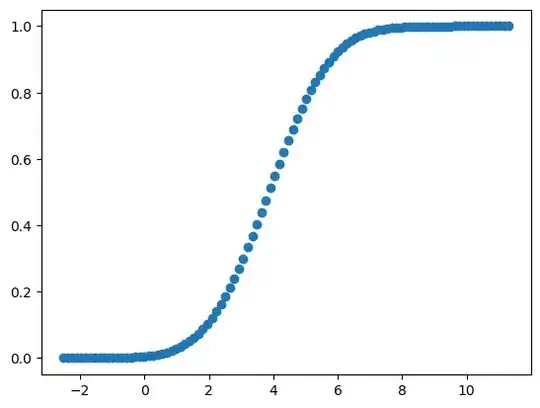
 Then what I can do it visualize CDF in terms of points.
density1=unity_density.cumsum()
x=bins[:-1]
y=density1

plt.plot(x, density1, 'o')

So what I have been trying to do is to use the np.interp function on the output of np.histogram in order to obtain a smooth curve representing the CDF and extracting the percent points to plot them. Ideally, I need to try to do it all both manually and using ppf function from scipy. I have always struggled with statistics as an undergraduate. I am in grad school now and try to put me through as many exercises like this as possible in order to get a deeper understanding of what is happening. I've reached a point of desperation with this task. Thank you!


