3

I have a 2D numpy array of type np.float64, and I want to show it as an image in a QLabel (or any other valid way):

self.img = np.rot90(get_my_data()) # this line returns a 2D numpy array of type np.float64
self.qimg = QtGui.QImage(self.img, self.img.shape[0], self.img.shape[1], QtGui.QImage.Format_Grayscale8)
self.myLabel.setPixmap(QtGui.QPixmap(self.qimg))

My code above returning the following error:

TypeError: arguments did not match any overloaded call:
QImage(): too many arguments
QImage(QSize, QImage.Format): argument 1 has unexpected type 'numpy.ndarray'
QImage(int, int, QImage.Format): argument 1 has unexpected type 'numpy.ndarray'
QImage(bytes, int, int, QImage.Format): argument 1 has unexpected type 'numpy.ndarray'
QImage(sip.voidptr, int, int, QImage.Format): argument 1 has unexpected type 'numpy.ndarray'
QImage(bytes, int, int, int, QImage.Format): argument 1 has unexpected type 'numpy.ndarray'
QImage(sip.voidptr, int, int, int, QImage.Format): argument 1 has unexpected type 'numpy.ndarray'
QImage(List[str]): argument 1 has unexpected type 'numpy.ndarray'
QImage(str, format: str = None): argument 1 has unexpected type 'numpy.ndarray'
QImage(QImage): argument 1 has unexpected type 'numpy.ndarray'
QImage(Any): too many arguments

But, if I add .copy() at the end of the first line, then it works! but it doesn't display the data correctly.

self.img = np.rot90(get_my_data()).copy()
self.qimg = QtGui.QImage(self.img, self.img.shape[0], self.img.shape[1], QtGui.QImage.Format_Grayscale8)
self.myLabel.setPixmap(QtGui.QPixmap(self.qimg))

Here is what the label displays compared with pyplot.imshow():

self.img = 20 * np.log10(np.rot90(get_my_data()).copy())
self.qimg = QtGui.QImage(self.img, self.img.shape[0], self.img.shape[1], QtGui.QImage.Format_Grayscale8)
self.myLabel.setPixmap(QtGui.QPixmap(self.qimg))
pyplot.imshow(self.img)
pyplot.show()

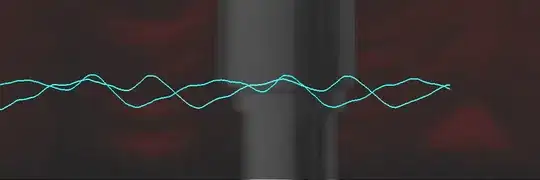
The result of pyplot.imshow() is:

enter image description here

While myLabel displays the following result:

enter image description here

So, what is wrong with my code?

Is there a more elegant way to display my 2D numpy array as an image?

eyllanesc
  • 235,170
  • 19
  • 170
  • 241
catfour
  • 119
  • 3
  • 10
  • What is the range of the values obtained from `get_my_data()`? Because if they are float values, you cannot use them as they are. Image formats accept 1, 8, 16, 24, 32 or 64 bit (as "integer" values) formats. If you know the range of the data, then you can convert the array to integer values. For example, if they're between 0 and 1, something like this might work (assuming you want 8bit conversion): `self.img = np.multiply(get_my_data(), 127).astype('int8')` – musicamante Feb 23 '20 at 00:20
  • @musicamante one of my samples has the range [3.2101597817728964e-05 12684375.661213763], and I cannot determine the maximum and minimum values in general, so how to deal with that? and how to display the resulting 2D numpy array of type int8 using QImage? Thank you. – catfour Feb 23 '20 at 00:32
  • @eyllanesc I wish, but it's a pretty large implementation of [STFT](https://en.wikipedia.org/wiki/Short-time_Fourier_transform). However, I'm taking the `20 * np.log10` of the result as you can see. – catfour Feb 23 '20 at 00:51

1 Answers1

3

From what I read the OP has an XY problem, that is, its objective is to show the output of imshow() in a Qt window, but ask about the attempt to display the data in a QImage.

The imshow() method does not show raw data but processes the information based on the parameters as indicated by the docs:

matplotlib.pyplot.imshow(X, cmap=None, norm=None, aspect=None, interpolation=None, alpha=None, vmin=None, vmax=None, origin=None, extent=None, shape=, filternorm=1, filterrad=4.0, imlim=, resample=None, url=None, *, data=None, **kwargs)

So if you want to obtain an image with that data you must implement that algorithm (you can check the source code of matplotlib or similar SW to analyze the logic)

If we focus on the real objective then the simplest solution is to use the Qt backend of matplotlib to obtain the appropriate canvas as shown below:

import numpy as np

from PyQt5 import QtWidgets
from matplotlib.backends.backend_qt5agg import FigureCanvas
from matplotlib.figure import Figure


class MainWindow(QtWidgets.QMainWindow):
    def __init__(self, parent=None):
        super().__init__(parent)

        self.figure = Figure(figsize=(5, 3))
        self.canvas = FigureCanvas(self.figure)
        self.ax = self.figure.subplots()

        delta = 0.025
        x = y = np.arange(-3.0, 3.0, delta)
        X, Y = np.meshgrid(x, y)
        Z1 = np.exp(-(X ** 2) - Y ** 2)
        Z2 = np.exp(-((X - 1) ** 2) - (Y - 1) ** 2)
        Z = (Z1 - Z2) * 2

        self.ax.imshow(Z)
        self.ax.set_axis_off()

        self.setCentralWidget(self.canvas)


if __name__ == "__main__":
    import sys

    app = QtWidgets.QApplication(sys.argv)
    w = MainWindow()
    w.resize(640, 480)
    w.show()

    sys.exit(app.exec_())

enter image description here

Update:

If you want to display the data from time to time then you can use a QTimer that updates the information as I show below:

import random
import numpy as np

from PyQt5 import QtCore, QtWidgets
from matplotlib.backends.backend_qt5agg import FigureCanvas
from matplotlib.figure import Figure


class MainWindow(QtWidgets.QMainWindow):
    def __init__(self, parent=None):
        super().__init__(parent)

        self.figure = Figure(figsize=(5, 3))
        self.canvas = FigureCanvas(self.figure)
        self.ax = self.figure.subplots()
        self.ax.set_axis_off()

        self.setCentralWidget(self.canvas)

        timer = QtCore.QTimer(self)
        timer.timeout.connect(self.on_timeout)
        timer.start(100)

    def on_timeout(self):
        x0, y0 = random.uniform(-2, 2), random.uniform(-2, 2)
        delta = 0.025
        x = y = np.arange(-3.0, 3.0, delta)
        X, Y = np.meshgrid(x, y)
        Z1 = np.exp(-(X ** 2) - Y ** 2)
        Z2 = np.exp(-((X - x0) ** 2) - (Y - y0) ** 2)
        Z = (Z1 - Z2) * 2
        self.ax.imshow(Z)
        self.canvas.draw()


if __name__ == "__main__":
    import sys

    app = QtWidgets.QApplication(sys.argv)
    w = MainWindow()
    w.resize(640, 480)
    w.show()

    sys.exit(app.exec_())

On the other hand, if you want to have a SW in real time then the GUI will limit that objective. It is advisable to show the data every N samples so that the GUI is not blocked and the user can view and analyze the information. The human eye is very slow, so even if the technology exists to display images every microsecond, our vision would not appreciate it, our vision requires 60ms to process the image, therefore the devices are designed to work at 30Hz since if the frequency were superior improvement would not be observed.

eyllanesc
  • 235,170
  • 19
  • 170
  • 241
  • The result of `get_my_data()` is $|STFT|^2$, because I need to display the real-time spectrogram of my audio data on a specific area of the window as simple as possible, and no matter what the widget to use. However, I used PyQtGraph to display the real-time audio data, and it plots very fast compared with Matplotlib. So, if you edit your answer to display the real-time spectrogram (which is a 2D image as shown above) I would really appreciate it. Thank you. – catfour Feb 23 '20 at 01:46
  • @catfour What you indicate supports the XY problem, I recommend you rewrite your question to indicate your real objective, in the title you indicate that you want a conversion to QImage but the real thing is that you want to obtain a QImage equivalent to what the imshow method of matplotlib shows – eyllanesc Feb 23 '20 at 01:55