I would like to know how to add colorbar and show it in app
import pandas as pd
import numpy as np
import matplotlib as mpl
import matplotlib.pylab as plt
import sys
from PyQt5.QtWidgets import *
from PyQt5.uic import loadUiType
from matplotlib.figure import Figure
from matplotlib.backends.backend_qt5agg import (
    FigureCanvasQTAgg as FigureCanvas,
    NavigationToolbar2QT as NavigationToolbar)
from PyQt5 import QtWidgets

# test is wafermap
test = pd.DataFrame(index=range(0,101), columns=range(0,101))
for i in range(0,101):
    for j in range(0,101):
        if ((50-i)**2 + (50-j)**2) < 50**2:
            test.loc[i,j] = i*2+i+j
        else:
            test.loc[i,j] = 0
test[test == 0] = np.nan

Ui_MainWindow, QMainWindow = loadUiType(r'C:\Users\wtjang\Wafer viewer\test_file_open.ui')


class Main(QMainWindow, Ui_MainWindow):
    def __init__(self, ):
        super(Main, self).__init__()
        self.setupUi(self)
        self.setStyleSheet("background-color : white;")


    def addmpl(self, fig):
        self.canvas = FigureCanvas(fig)
        self.mplvl.addWidget(self.canvas)
        self.canvas.draw()


if __name__ == "__main__":
    import sys
    from PyQt5 import QtWidgets

    fig1 = Figure()

    ax1f1 = fig1.add_subplot(111)
    ax1f1.imshow(test, interpolation = 'hanning', vmin = 0, cmap = 'gist_rainbow_r')

    app = QtWidgets.QApplication(sys.argv)
    main = Main()
    main.addmpl(fig1)

    main.show()
    sys.exit(app.exec_())
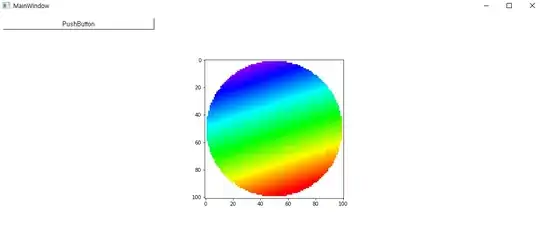
I got a below output
But I would like to get below image. In other words, I would like to add colorbar.

So I tried to add colorbar. But I failed....
ax1f1.imshow(test, interpolation = 'hanning', vmin = 0, cmap = 'gist_rainbow_r')
ax1f1.colorbar()
I got an error
AttributeError: 'AxesSubplot' object has no attribute 'colorbar'
How can I get it?