-1

under the two conditions of "Simulated" and "Measured" (See the image),

enter image description here

I want to calculate some error metrics such as Nash-Sutcliffe efficiency (NSE) or root mean square error (RMSE), but I don't know how to code the command. There are 728 simulated values, while measured values only 30. Could anyone help me, please? Thank you!

library(readxl)
library(hydroGOF)
library(zoo)
X0_40cm <- read_excel("C:/Rstudy/For_10-40cm.xlsx")
data(X0_40cm)
Artem Sokolov
  • 13,196
  • 4
  • 43
  • 74
Chouette
  • 153
  • 7
  • Length of simulated and measured should be same and put the measured and simulated column side by side. If you can provide the data in `dput()` format, I can help you out. – UseR10085 Feb 08 '20 at 05:39
  • That would be so good! Thank you! – Chouette Feb 08 '20 at 19:59
  • > dput(my_data) structure(list(Date = structure(c(1507852800, 1507939200, 1508025600, 1508112000, 1508198400, 1508284800, 1508371200, 1508457600, 1508544000, 1508630400, 1508716800, 1508803200, 1508889600, 1508976000), class = c("POSIXct","POSIXt"), tzone = "UTC"), Simulated = c(0.23375, 0.23175, 0.231, 0.2305, 0.2405, 0.24, 0.2385, 0.23675, 0.2355, 0.234, 0.23225, 0.23075, 0.2295, 0.2285), Measured = c(NA, 0.273, NA, NA, 0.21311677200277, NA, NA, NA, NA, 0.229871184500008, NA, NA, 0.242, NA)), row.names = c(NA, -14L), class = c("tbl_df", "tbl", "data.frame")) – Chouette Feb 08 '20 at 20:23

2 Answers2

1

Use the following code to calculate NSE and rmse with hydroGOF package

library(hydroGOF)
NSE(df$Simulated, df$Measured, na.rm = T)
#[1] -37.85747
rmse(df$Simulated, df$Measured, na.rm = T)
#[1] 0.02561592

Data

df = structure(list(Date = structure(c(1507852800, 1507939200, 1508025600,
1508112000, 1508198400, 1508284800, 1508371200, 1508457600, 1508544000,
1508630400, 1508716800, 1508803200, 1508889600, 1508976000), 
class = c("POSIXct","POSIXt"), tzone = "UTC"), 
Simulated = c(0.23375, 0.23175, 0.231, 0.2305, 0.2405, 0.24, 0.2385, 0.23675, 0.2355, 0.234, 0.23225, 0.23075, 0.2295, 0.2285), 
Measured = c(NA, 0.273, NA, NA, 0.21311677200277, NA, NA, NA, NA, 0.229871184500008, NA, NA, 0.242, NA)), 
row.names = c(NA, -14L), class = c("tbl_df", "tbl", "data.frame")) 

Update

df <- structure(list(Date = structure(c(1507852800, 1507939200, 1508025600, 1508112000, 1508198400, 1508284800, 1508371200, 1508457600, 1508544000, 1508630400, 1508716800, 1508803200, 1508889600, 1508976000), class = c("POSIXct","POSIXt"), tzone = "UTC"), Simulated = c(0.23375, 0.23175, 0.231, 0.2305, 0.2405, 0.24, 0.2385, 0.23675, 0.2355, 0.234, 0.23225, 0.23075, 0.2295, 0.2285), Measured = c(NA, 0.273, NA, NA, 0.21311677200277, NA, NA, NA, NA, 0.229871184500008, NA, NA, 0.242, NA)), row.names = c(NA, -14L), class = c("tbl_df", "tbl", "data.frame"))
View(df)
library(dplyr)
library(hydroGOF)
library(zoo)

Simulated <- df$Simulated
Measured <- df$Measured
Date <- df$Date

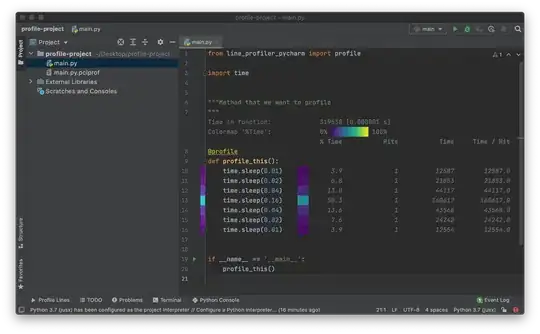
ggof(sim=Simulated, obs=Measured, na.rm = TRUE, dates = Date, date.fmt = "%Y-%m-%d",,
     pt.style = "ts", ftype = "o", FUN,
     stype="default",
     gof.leg = TRUE, digits=2,
     gofs=c("ME", "MAE", "RMSE", "NRMSE", "PBIAS", "RSR", "rSD", "NSE", "mNSE",
            "rNSE", "d", "md", "rd", "r", "R2", "bR2", "KGE", "VE"),
     col = c("black", "red"),
     main="Try", #Provide the chart title here
     xlab = "Time", #Change the x-axis title here
     ylab=c("Q, [m3/s]"), #Change the y-axis title here
     lwd = c(2, 1), #To change the line width
     cex = c(1, 2)) #To change the size of the points
enter image description here

UseR10085
  • 7,120
  • 3
  • 24
  • 54
  • Thank you for your help! But I stil meet one slight problem about changing the size of line and point separately. Also I failed to change the title of X-, Y- axis and main title. The below is the code I used. Could you please help me check maybe? – Chouette Feb 09 '20 at 16:24
  • I left the code in a new post since it's a little bit long. Thank you again! – Chouette Feb 09 '20 at 16:33
  • @LINKANG see my update. If you need any further help regarding this and don't forget to accept the answer. – UseR10085 Feb 10 '20 at 05:06
  • I have accepted the answer:) and I have one last question"How can the Y-axis be changed to percent?" Thank you! – Chouette Feb 10 '20 at 12:29
  • @LINKANG I didn't get you. What do you mean by "How can the Y-axis be changed to percent?" Can you please elaborate it with desired output, it can be handwritten also. You can edit your question with the desired output. – UseR10085 Feb 11 '20 at 04:40
  • [link](https://i.stack.imgur.com/Vo9yy.png) Can you see the link? – Chouette Feb 11 '20 at 11:01
  • No need to provide repetitive % sign in the y-axis ticks rather you can mention the unit as % within parenthesis. Your data should be in %. – UseR10085 Feb 11 '20 at 11:12
  • Thank you! But Can I know what code can help if I want to change the data in %? – Chouette Feb 11 '20 at 15:06
0
df <- structure(list(Date = structure(c(1507852800, 1507939200, 1508025600, 1508112000, 1508198400, 1508284800, 1508371200, 1508457600, 1508544000, 1508630400, 1508716800, 1508803200, 1508889600, 1508976000), class = c("POSIXct","POSIXt"), tzone = "UTC"), Simulated = c(0.23375, 0.23175, 0.231, 0.2305, 0.2405, 0.24, 0.2385, 0.23675, 0.2355, 0.234, 0.23225, 0.23075, 0.2295, 0.2285), Measured = c(NA, 0.273, NA, NA, 0.21311677200277, NA, NA, NA, NA, 0.229871184500008, NA, NA, 0.242, NA)), row.names = c(NA, -14L), class = c("tbl_df", "tbl", "data.frame"))
View(df)
library(foreign)
library(dplyr)
library(readxl)
library(scales)
library(hydroGOF)
library(zoo)

Simulated <- df$Simulated
Measured <- df$Measured
Date <- df$Date

ggof(sim=Simulated, obs=Measured, na.rm = TRUE, dates = Date, date.fmt = "%Y-%m-%d",,
     pt.style = "ts", ftype = "o", FUN,
     stype="default",
     gof.leg = TRUE, digits=2,
     gofs=c("ME", "MAE", "RMSE", "NRMSE", "PBIAS", "RSR", "rSD", "NSE", "mNSE",
            "rNSE", "d", "md", "rd", "r", "R2", "bR2", "KGE", "VE"),
     col = c("black", "red"))
Chouette
  • 153
  • 7