working with nfl data here.. trying gganimate for the first time... trying to use geom_point and geom_line but geom_line will not appear..
data frame here..
week = c(1,2,3,4,5,6,8,9,10,11,12,13,14,15,16,17)
plays= c(9,10,5,3,4,4,3,5,6,5,11,12,6,11,7,3)
mean_epa= c(.67, .27, -.5, -1.09, -.3, .68, -.72, -.32, 1.03, 1.05, .56, .17, -.61, -.05, -.14, 1.5)
CLEdrive1b <- data.frame(week,plays,mean_epa)
within week variable, 7 is missing (because browns did not have game week 7)... not sure if that is causing issues?
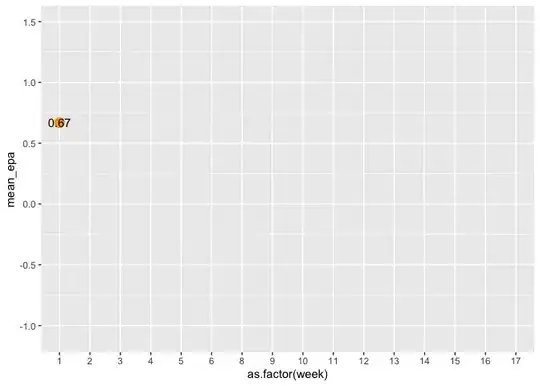
my first attempt below
p <- ggplot(CLEdrive1b, aes(x=as.factor(week),y=mean_epa)) +
  theme_minimal() +
  geom_point(aes(group = seq_along(week)), color = "orange", size = 4) +
  geom_line(alpha = 0.5)+
  transition_reveal(week)+
  geom_text(aes(label = mean_epa))+
  xlab("Week") +
  ylab("EPA/Play") +
  labs(title="Browns Opening Drives",
       subtitle = "EPA/Drive by Week",
       caption="Data from nflscrapR")+
  theme(axis.title = element_text(size = 10),
        axis.text = element_text(size = 9),
        plot.title = element_text(size = 15),
        plot.subtitle = element_text(size = 10),
        plot.caption = element_text(size = 8))

animate(p)

alternative method I tried..
pi <- ggplot(CLEdrive1b, aes(week,y=mean_epa)) +
  theme_minimal() +
  geom_point(aes(group = seq_along(week)), color = "orange", size = 4) +
  geom_line(alpha = 0.5)+
  transition_reveal(week)+
  geom_text(aes(label = mean_epa))+
  xlab("Week") +
  ylab("EPA/Play") +
  labs(title="Browns Opening Drives",
       subtitle = "EPA/Drive by Week",
       caption="Data from nflscrapR")+
  theme(axis.title = element_text(size = 10),
        axis.text = element_text(size = 9),
        plot.title = element_text(size = 15),
        plot.subtitle = element_text(size = 10),
        plot.caption = element_text(size = 8))

animate(pi)

removed as.factor from x variable (week).. and geom_line appears! but x-axis loses labels I am seeking and geom_text stops performing how it was above..
thank you for spending time to help...