2
library("tidyverse")
library("papaja")

df <- structure(list(investment_type = structure(c(3L, 3L, 3L, 3L, 
3L, 3L, 3L, 1L, 3L, 3L, 3L, 3L, 3L, 3L, 3L, 3L, 1L, 3L, 3L, 3L, 
3L), .Label = c("angel", "pre_seed", "seed"), class = "factor"), 
    gender_d = c(1, 1, 0, 1, 1, 1, 1, 1, 1, 1, 0, 0, 1, 1, 1, 
    1, 1, 1, 1, 0, 1), state_code_org = structure(c(3L, 22L, 
    3L, 15L, 3L, 4L, 3L, 3L, 22L, 3L, 29L, 25L, 8L, 29L, 10L, 
    6L, 22L, 4L, 17L, 23L, 17L), .Label = c("AL", "AR", "CA", 
    "CO", "CT", "DC", "DE", "FL", "GA", "IL", "KS", "LA", "MA", 
    "MD", "MN", "MO", "NC", "NE", "NH", "NJ", "NV", "NY", "OH", 
    "OR", "PA", "RI", "SC", "TN", "TX", "UT", "VA", "VT", "WA", 
    "WI", "WY"), class = "factor"), first_time_founder_d = c(0, 
    1, 1, 1, 1, 1, 0, 1, 1, 1, 1, 0, 1, 1, 1, NA, 1, 0, 0, 1, 
    0)), class = c("tbl_df", "tbl", "data.frame"), row.names = c(NA, 
-21L))

df <- df %>%
  select(investment_type,
         state_code_org,
         gender_d,
         first_time_founder_d) %>%
  mutate_at(c("gender_d", "first_time_founder_d"), list(~ factor(.))) %>%
  mutate(gender_d=factor(ifelse(gender_d==1, "Male", "Female"))) %>%
  mutate(first_time_founder_d=factor(ifelse(first_time_founder_d==1, "Yes", "No"))) %>%
  mutate(investment_type=factor(ifelse(investment_type=="angel", "Angel", ifelse(investment_type=="pre_seed", "Pre-Seed", "Seed")))) %>%
  drop_na() %>%
  summary() %>%
  as.data.frame()

# Clean up columns
df <- df %>%
  select(-Var1) %>%
  rename(Variable=Var2, N=Freq) %>%
  mutate(Variable=factor(ifelse(Variable=="investment_type", "Investment Type", ifelse(Variable=="state_code_org", "State", ifelse(str_detect(Variable, "gender_d"), "Gender", "First-Time Founder"))))) %>%
  drop_na()

# break N into level and N
df <- df %>%
  separate(col = N, into = c("Level", "N"), sep = ":")

# Remove white space in values
df <- df %>% 
  mutate(
    Variable=trimws(Variable)) %>%
  mutate(
    Level=trimws(Level)) %>%
  mutate(
    N=trimws(N))

# Convert N to integer
df <- df %>% 
  mutate(N=as.integer(N))

df <- df %>% 
  group_by(Variable) %>% 
  arrange(Variable, desc(N))
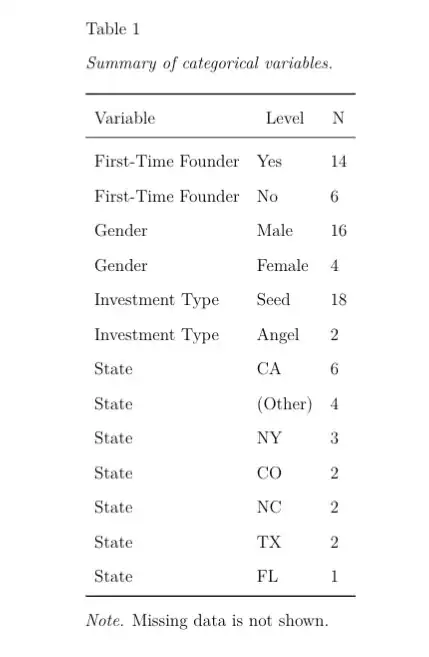
apa_table(
  df,
  # stub_indents = list("1", "2"),
  caption = "Summary of categorical variables.",
  note = "Missing data is not shown.")

Here is what I'm getting now.

I am open to using any packages--this happens to use papaja. But it needs to work in rmarkdown with PDF output and comply with APA style.

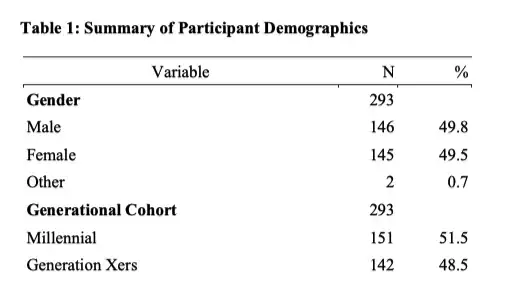
I would like the table to collapse the Variable values so they are not repeated more than once and also move the State (Other) to the bottom of the state grouping. Something like this (different data set) as an example:

Kevin T
  • 141
  • 1
  • 12
  • What is `founders`? – r2evans Feb 01 '20 at 17:25
  • I'm hoping there was a way more straightforward way to get to what I hacked together, btw. – Kevin T Feb 01 '20 at 17:37
  • *"collapse the Variable values"*, what do you mean by that? Do you mean to drop `Level`, perhaps with `group_by(df, Variable) %>% summarize(N = sum(N))` (plus `%`)? – r2evans Feb 01 '20 at 17:48
  • @r2evans, by collapse, I mean not have it repeated for each level. EG in the second example image, that table has the Variable in bold with a total N value and then underneath it lists the levels with their individual N values. (Gender has Male, Female, Other levels). – Kevin T Feb 01 '20 at 19:12

3 Answers3

3

You might try the gt package (not yet on CRAN).

# devtools::install_github("rstudio/gt")
library(gt)
df %>%
  mutate(`%` = scales::percent(N / sum(N), 1)) %>%
  gt() %>%
  tab_header(
    title = "Summary of categorical variables."
  ) %>%    
  tab_source_note(
    source_note = md("*Missing data is not shown.*")
  )

html output

This is the HTML rendition. It's using dplyr's groups to determine the row-grouping.

The repo and https://gt.rstudio.com both say that it supports output in HTML, with LaTeX and RTF planned for the future, but it somewhat works.

df %>%
  mutate(`%` = scales::percent(N / sum(N), 1)) %>%
  gt() %>%
  # tab_header(
  #   title = "Summary of categorical variables.", subtitle = ""
  # ) %>%    
  tab_source_note(
    source_note = md("*Missing data is not shown.*")
  ) %>%
  as_latex()

There is a bug with tab_header and latex output (https://github.com/rstudio/gt/issues/463), and it looks like tab_source_note might be a bit askew as well.

pdf output

I rearranged things a little, and was able to get this, though I'm confident it isn't exactly what you're going for. (This suggests that anything non-whitespace in the subtitle allows tab_header to work, but " " -- any number of spaces -- does not work.)

df %>%
  mutate(`%` = scales::percent(N / sum(N), 1)) %>%
  gt() %>%
  tab_header(
    title = "Summary of categorical variables.",
    subtitle = md("*Missing data is not shown.*")
  ) %>%    
  as_latex()

pdf output with subtitle

r2evans
  • 141,215
  • 6
  • 77
  • 149
3

Here's another approach using apa_table().

First a simpler way to summarize your data:

library("dplyr")
library("tidyr")

df <- structure(list(investment_type = structure(c(3L, 3L, 3L, 3L, 
                                             3L, 3L, 3L, 1L, 3L, 3L, 3L, 3L, 3L, 3L, 3L, 3L, 1L, 3L, 3L, 3L, 
                                             3L), .Label = c("angel", "pre_seed", "seed"), class = "factor"), 
               gender_d = c(1, 1, 0, 1, 1, 1, 1, 1, 1, 1, 0, 0, 1, 1, 1, 
                            1, 1, 1, 1, 0, 1), state_code_org = structure(c(3L, 22L, 
                                                                            3L, 15L, 3L, 4L, 3L, 3L, 22L, 3L, 29L, 25L, 8L, 29L, 10L, 
                                                                            6L, 22L, 4L, 17L, 23L, 17L), .Label = c("AL", "AR", "CA", 
                                                                                                                    "CO", "CT", "DC", "DE", "FL", "GA", "IL", "KS", "LA", "MA", 
                                                                                                                    "MD", "MN", "MO", "NC", "NE", "NH", "NJ", "NV", "NY", "OH", 
                                                                                                                    "OR", "PA", "RI", "SC", "TN", "TX", "UT", "VA", "VT", "WA", 
                                                                                                                    "WI", "WY"), class = "factor"), first_time_founder_d = c(0, 
                                                                                                                                                                             1, 1, 1, 1, 1, 0, 1, 1, 1, 1, 0, 1, 1, 1, NA, 1, 0, 0, 1, 
                                                                                                                                                                             0)), class = c("tbl_df", "tbl", "data.frame"), row.names = c(NA, 
                                                                                                                                                                                                                                          -21L))

factor_level_count <- df %>% 
  mutate(
    gender_d = factor(gender_d, levels = c(0, 1), labels = c("Female", "Male"))
    , first_time_founder_d = factor(first_time_founder_d, levels = c(0, 1), labels = c("No", "Yes"))
    , investment_type = factor(investment_type, levels = c("angel", "pre_seed", "seed"), labels = c("Angel", "Pre-Seed", "Seed"))
  ) %>%
  na.exclude %>% 
  pivot_longer(cols = everything()) %>% 
  group_by(name, value) %>% 
  count() %>%
  ungroup() %>% 
  mutate(
    name = factor(name , levels = c("first_time_founder_d", "gender_d", "investment_type", "state_code_org"), labels = c("Firt-Time Founder", "Gender", "Investement Type", "State"))
  ) %>% 
  group_by(name) %>% 
  mutate(percent = printnum(n / sum(n) * 100, digits = 1)) %>% 
  rename(Variable = value, N = n, "%" = percent)

Now you can split the data.frame and recombine them into a named list to get stub indents.

factor_level_count_list <- split(factor_level_count, f = factor_level_count$name, drop = TRUE) %>% 
  lapply(function(x) x[, -1]) # Removes split-column

library("papaja")

apa_table(
  factor_level_count_list
  , align = "llr"             # Right-align last column
  , caption = "Summary of categorical variables."
  , note = "Missing data is not shown."
  , merge_method = "indent"   # Table style to use for merging list elements
  , midrules = c(3, 6, 9)
)

enter image description here

crsh
  • 1,699
  • 16
  • 33
  • Thank you. This cleans up the code nicely and the table indentation is more in-line with what I was looking for. – Kevin T Feb 08 '20 at 10:37
1

I think this here would be a simple solution:

df$Variable[duplicated(df$Variable)] <- ""     # remove duplicated labels
df <- df[c(1:7, 9:13, 8), ]                    # move "(other)" to last row

apa_table(
  df,
  align = "llr",                               # right-align last column
  caption = "Summary of categorical variables.",
  note = "Missing data is not shown.")

which renders like:

enter image description here

Marius Barth
  • 596
  • 2
  • 9