0

I would like to plot two routes which overlap in some parts using osmnx and python. I used yellow as a colour for route 1 and blue for route 2. To clarify what I mean using pictures:

This is the plot of route 1 only:

Plot of route 1

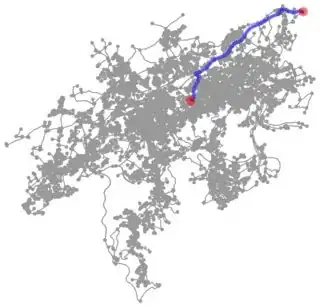
This is the plot of route 2 only:

Plot of route 2

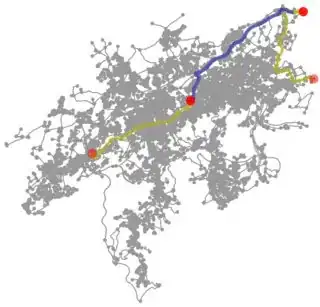
This is the plot of route 1 and 2 together:

Plot of route 1 and 2 together

This is an exemplary snippet from my code:

ox.plot_graph_routes(Graph, route1, route_color=['y']*len(route1))
ox.plot_graph_routes(Graph, route2, route_color=['b']*len(route2))
ox.plot_graph_routes(Graph, route1+route2, route_color=['y']*len(route1) + ['b']*len(route(2))

As you can see in the plot of route 1 and 2 together, it would be more convenient to have a blue/yellow hatched pattern or something like that for the part where route 1 and route 2 overlap.

Does anyone know how to define a color that is a pattern of e.g. blue and yellow, so that I can pass it to the 'route_color' argument in the plot_graph_routes function?

JohanC
  • 71,591
  • 8
  • 33
  • 66
  • Maybe you could try whether [this solution](https://stackoverflow.com/a/59130504/12046409) also works wih osmnx? – JohanC Jan 08 '20 at 14:49
  • This is exactly what I want it to look like. I might try to get the x, y coordinates of the routes and plot them like in the above solution. I'll keep you updated if it worked out. – katherinejohnson Jan 13 '20 at 15:25

1 Answers1

1

1) I plotted the graph without the routes using:

ox.plot_graph(Graph)

2) The part that I want to be yellow AND blue is the intersection of route1 and route2:

yellow_and_blue = list(set(route1).intersection(route2))

The part that I want to be yellow only is the the difference of route1 and route2:

yellow = list(set(route1).difference(route2))

2) As my routes route1 and route2 are lists of OSM IDs, so are yellow_and_blue and yellow. I extracted their x and y coordinates using:

yellow_and_blue_x = []
yellow_and_blue_y = []
for node in yellow_and_blue:
    yellow_and_blue_x += [Graph.nodes[node]['x']]
    yellow_and_blue_y += [Graph.nodes[node]['y']]

The same works for yellow.

3) Now that we have lists of x and y coordinates of the routes we would like to plot, we can use

plt.plot(yellow_and_blue_x, yellow_and_blue_y, linestyle = (0,(5,5)), color = 'yellow')
plt.plot(yellow_and_blue_x, yellow_and_blue_y, linestyle = (5,(5,5)), color = 'blue')

and

plt.plot(yellow_x, yellow_y, color = 'yellow')

to plot the routes onto our previously generated plot.