to build the chart dynamically, from timeofday values,
first use a data view to convert timeofday to minutes
// use calculated column to convert time of day to duration in minutes
var view = new google.visualization.DataView(data);
view.setColumns([0, {
  calc: function (dt, row) {
    // initialize variables
    var minutesFormat = '';
    var minutesValue = 0;
    var timeofday = dt.getValue(row, 1);

    // calculate total minutes
    timeofday.forEach(function (value, index) {
      // determine time part
      switch (index) {
        // hours
        case 0:
          minutesFormat += value;
          minutesValue += (value * 60);
          break;

        // minutes
        case 1:
          minutesFormat += ':' + value;
          minutesValue += value;
          break;

        // seconds
        case 2:
          minutesValue += (value / 60);
          break;

        // miliseconds
        case 3:
          minutesValue += (value / 60000);
          break;
      }
    });

    // build object notation
    return {
      v: minutesValue,
      f: minutesFormat
    };
  },
  label: data.getColumnLabel(1),
  type: 'number'
}]);
then for the y-axis ticks,
first, get the max number of minutes.
// get range of duration in muntes
var range = view.getColumnRange(1);  // range.max
then we need to determine the number of hours to round to (10, 100, 1000)
// determine max number of hours for y-axis
var maxHours = Math.ceil(range.max / 60);
var roundTo = parseInt('1' + Array(maxHours.toFixed(0).length).join('0'));
var maxHours = Math.ceil((range.max / 60) / roundTo) * roundTo;
then build our ticks...
// build y-axis ticks
var ticks = [];
for (var hour = 0; hour <= maxHours; hour += roundTo) {
  ticks.push({
    v: hour * 60,
    f: hour + ':00'
  });
}
see following working snippet...
google.charts.load('current', {
  packages: ['corechart']
}).then(function () {
  var data = new google.visualization.DataTable();
  data.addColumn('string', 'Topping');
  data.addColumn('timeofday', 'Duration');
  data.addRows([
    ['Me', [23,59,0]],
    ['My Boss', [47,59,0]]
  ]);

  // use calculated column to convert time of day to duration in minutes
  var view = new google.visualization.DataView(data);
  view.setColumns([0, {
    calc: function (dt, row) {
      // initialize variables
      var minutesFormat = '';
      var minutesValue = 0;
      var timeofday = dt.getValue(row, 1);

      // calculate total minutes
      timeofday.forEach(function (value, index) {
        // determine time part
        switch (index) {
          // hours
          case 0:
            minutesFormat += value;
            minutesValue += (value * 60);
            break;

          // minutes
          case 1:
            minutesFormat += ':' + value;
            minutesValue += value;
            break;

          // seconds
          case 2:
            minutesValue += (value / 60);
            break;

          // miliseconds
          case 3:
            minutesValue += (value / 60000);
            break;
        }
      });

      // build object notation
      return {
        v: minutesValue,
        f: minutesFormat
      };
    },
    label: data.getColumnLabel(1),
    type: 'number'
  }]);

  // get range of duration in muntes
  var range = view.getColumnRange(1);

  // determine max number of hours for y-axis
  var maxHours = Math.ceil(range.max / 60);
  var roundTo = parseInt('1' + Array(maxHours.toFixed(0).length).join('0'));
  var maxHours = Math.ceil((range.max / 60) / roundTo) * roundTo;

  // build y-axis ticks
  var ticks = [];
  for (var hour = 0; hour <= maxHours; hour += roundTo) {
    ticks.push({
      v: hour * 60,
      f: hour + ':00'
    });
  }

  var options = {
    title: 'How Long We Ate Pizza',
    width: 400,
    height: 300,
    vAxis: {
      ticks: ticks
    }
  };

  var chart = new google.visualization.ColumnChart(document.getElementById('chart_div'));
  chart.draw(view, options);
});
<script src="https://www.gstatic.com/charts/loader.js"></script>
<div id="chart_div"></div>
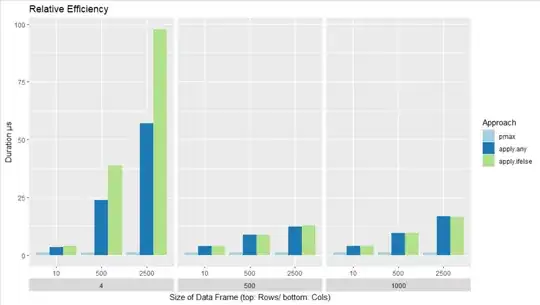
 If I format it to string, I get