I've encountered something very strange when having a function which generates an NdOverlay of Points to a DynamicMap, where the function is tied to panel widgets (I don't think the panel widgets are important).
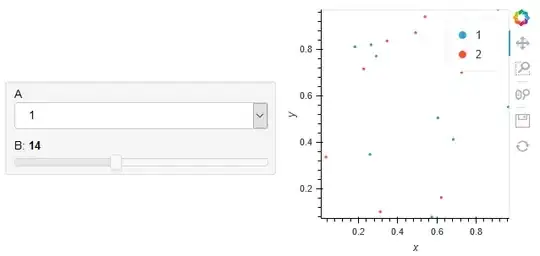
The below code is a working example which produces the expected behavior. Whenever you change the widget values a new plot is generated with two sets of Points overlaid, with different colors and respective legend entries. Image shown below code.
a_widget = pn.widgets.Select(name='A', options=[1,2,3,4])
b_widget = pn.widgets.IntSlider(name='B', start=10, end=20, value=10)
widget_box = pn.WidgetBox(a_widget, b_widget, align='center')

@pn.depends(a=a_widget.param.value, b=b_widget.param.value)
def get_points(a, b):
    return hv.NdOverlay({x: hv.Points(np.random.rand(10,10)) for x in range(1,3)})

points = hv.DynamicMap(get_points)

pn.Row(widget_box, points)
The second example shown below, is meant to demonstrate that in certain situations you might want to just simply return an empty plot and the way that I've done it in this example is done in the same way as in this example: http://holoviews.org/gallery/demos/bokeh/box_draw_roi_editor.html#bokeh-gallery-box-draw-roi-editor
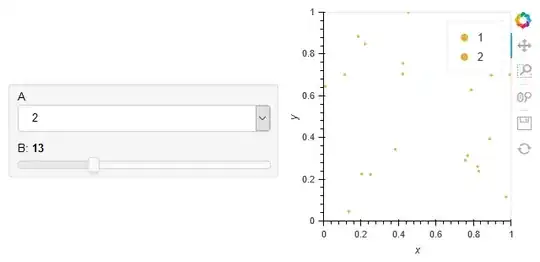
The result of this code is an empty plot as expected when a == 1, but when a has values other than 1, the result is quite strange as illustrated in the image below the code.
- The points all have the same color
- When changing the slider for instance, some points are frozen and never changes, which is not the case in the above working example.
a_widget = pn.widgets.Select(name='A', options=[1,2,3,4])
b_widget = pn.widgets.IntSlider(name='B', start=10, end=20, value=10)
widget_box = pn.WidgetBox(a_widget, b_widget, align='center')

@pn.depends(a=a_widget.param.value, b=b_widget.param.value)
def get_points(a, b):
    if a == 1:
        return hv.NdOverlay({None: hv.Points([])})
    else:
        return hv.NdOverlay({x: hv.Points(np.random.rand(10,10)) for x in range(1,3)})

points = hv.DynamicMap(get_points)

pn.Row(widget_box, points)