How to make plotly::ggplotly correctly render/print linetypes when using ggplot2 geom_bar?
Here is a reproductible exemple:
library(tidyverse)
library(plotly)

# this shows the problem
static_plot = ggplot(data = mtcars, aes(x = rownames(mtcars), y = mpg, linetype=as.character(cyl))) +
  geom_bar(stat = "identity", fill = NA, color = "black")
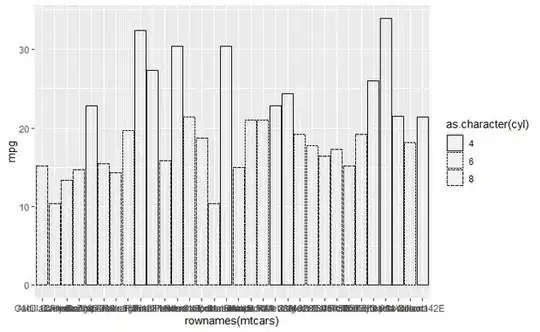
print(static_plot) # see that here we have different linetypes as expected

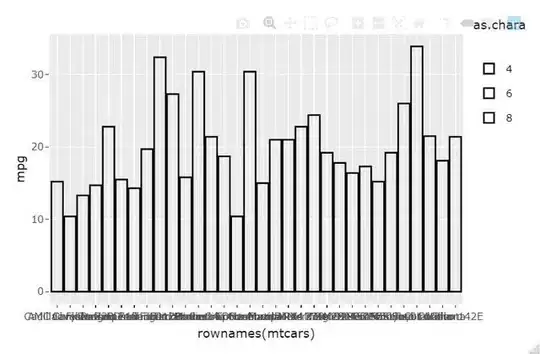
ggplotly(static_plot) # the lines are all the same i.e continuous!
output from print(static_plot) with expected linetypes:
ouput from ggplotly(static_plot); linetype aesthetic has not been taken into account
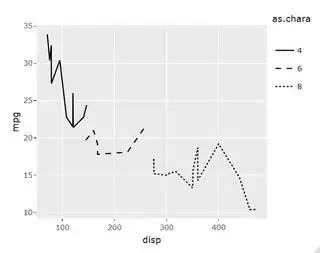
# using a geom_line it works fine
static_plot2 = ggplot(data = mtcars, aes(x = disp, y = mpg, linetype=as.character(cyl))) +
  geom_line(color = "black")
print(static_plot2)

ggplotly(static_plot2)
Maybe this is obvious but I can't find the trick to do it...


