8

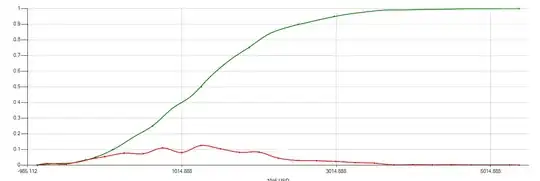
I'm using Recharts to draw some charts. Depending on the length of the data array, the chart doesn't start at x = 0 (not at the intersection of x and y) and doesn't finish at the max value of x:

enter image description here

How can I force it to always begin at x = 0 and occupy all the x axis?

This is how I'm implementing it:

        <ResponsiveContainer width="100%" height={400}>
            <ComposedChart
                data={chartContent.content.chart}
                //data={data}
                margin={{ top: 5, bottom: 5, left: 5 }}
            >
                <defs>
                    <linearGradient
                        id="colorBtc"
                        x1="0"
                        y1="0"
                        x2="0"
                        y2="1"
                    >
                        <stop
                            offset="5%"
                            stopColor="#ff9500"
                            stopOpacity={0.8}
                        />
                        <stop
                            offset="95%"
                            stopColor="#ff9500"
                            stopOpacity={0}
                        />
                    </linearGradient>
                    <linearGradient
                        id="colorStock"
                        x1="0"
                        y1="0"
                        x2="0"
                        y2="1"
                    >
                        <stop
                            offset="5%"
                            stopColor="#00a1e4"
                            stopOpacity={0.8}
                        />
                        <stop
                            offset="95%"
                            stopColor="#00a1e4"
                            stopOpacity={0}
                        />
                    </linearGradient>
                </defs>
                <XAxis
                    dataKey="date"
                    tickFormatter={formatDate}
                />
                <YAxis tickFormatter={formatYAxis} />
                <CartesianGrid strokeDasharray="3 3" />
                <Tooltip
                    formatter={formatTooltip}
                    labelFormatter={formatDate}
                />
                <Legend />
                <Area
                    name={t("Total amount in BTC")}
                    type="monotone"
                    dataKey="investment_total_btc"
                    stroke="#ff9500"
                    fillOpacity={1}
                    fill="url(#colorBtc)"
                />
                <Area
                    name={`${t("Total amount in")} ${
                        chartContent.content.symbol
                    }`}
                    type="monotone"
                    dataKey="investment_total_stock"
                    stroke="#00a1e4"
                    fillOpacity={1}
                    fill="url(#colorStock)"
                />
                <Line
                    name={t("Total invested in $")}
                    dataKey="invested"
                    type="monotone"
                    stroke="#ff0000"
                    dot={false}
                />
            </ComposedChart>
        </ResponsiveContainer>

Unfortunately the API documentation is not so clear and I couldn't find a solution.

Thanks in advance
Otavio Bonder
  • 1,789
  • 4
  • 17
  • 35

2 Answers2

3

What helped in my scenario was to add dataMax + 1 to the domain parameter of the XAxis component.

Based on what the documentation says I would have assumed that adding 'dataMin' for the first element of the domain array would help. However, it was dataMax + 1 that resolved it for me

Full snippet

        <XAxis
          dataKey="date"
          name="Time"
          type="number"
          domain={["dataMin", "dataMax + 1"]}
          tickFormatter={(tickItem) => moment(tickItem).format("MMM Do YY")}
       />
MZokov
  • 316
  • 1
  • 3
  • 11
1

Adding domain={["dataMin", "dataMax + 1"]} doesn't work, since the XAxis type in my case is category(the default value).

According to the library API document, in order to set domain, the XAxis type should be "number"reference

For category type XAxis, I found that Priyank Kachhela pointed out an alternative solution. You can specify the scale of XAxis to be point( the default scale is band ). It resolved my issue.

     <XAxis
       dataKey="date"
       tickFormatter={formatDate}
       scale="point"
     />
Kelei Ren
  • 360
  • 4
  • 10