2

I want to remove noises from a recorded sound and make the fft of it finding fundamental frequencies of that sound, but I don't know how to remove those noises. I'm recording the sound of falling objects from different heights. I want to find the relation between the height and the maximum frequency of the recorded sound.

  [y,fs]=wavread('100cmfreefall.wav');

 ch1=y(:,1);
 time=(1/44100)*length(ch1);
t=linspace(0,time,length(ch1));


L=length(ch1);
 NFFT = 2^nextpow2(L); % Next power of 2 from length of y
Y = fft(y,NFFT)/L;
Y1=log10(Y);
figure(1)

f = fs/2*linspace(0,1,NFFT/2+1);
plot(f,2*abs(Y1(1:NFFT/2+1))) ;

[b,a]=butter(10,3000/(44100/2),'high');
Y1=filtfilt(b,a,Y1);

% freqz(b,a)
figure(2)

plot(f,2*abs(Y1(1:NFFT/2+1))) ;

title('Single-Sided Amplitude Spectrum of y(t)');
xlabel('Frequency (Hz)');
ylabel('|Y(f)|')
xlim([0 50000])


% soundsc(ch1(1:100000),44100)
yuna
  • 41
  • 1
  • 1
  • 5

2 Answers2

19

Saying that there is noise in your signal is very vague and doesn't convey much information at all. Some of the questions are:

  • Is the noise high frequency or low frequency?
  • Is it well separated from your signal's frequency band or is it mixed in?
  • Does the noise follow a statistical model? Can it be described as a stationary process?
  • Is the noise another deterministic interfering signal?

The approach you take will certainly depend on the answers to the above questions.

However, from the experiment setup that you described, my guess is that your noise is just a background noise, that in most cases, can be approximated to be white in nature. White noise refers to a statistical noise model that has a constant power at all frequencies.

The simplest approach will be to use a low pass filter or a band pass filter to retain only those frequencies that you are interested in (a quick look at the frequency spectrum should reveal this, if you do not know it already). In a previous answer of mine, to a related question on filtering using MATLAB, I provide examples of creating low-pass filters and common pitfalls. You can probably read through that and see if it helps you.

A simple example:

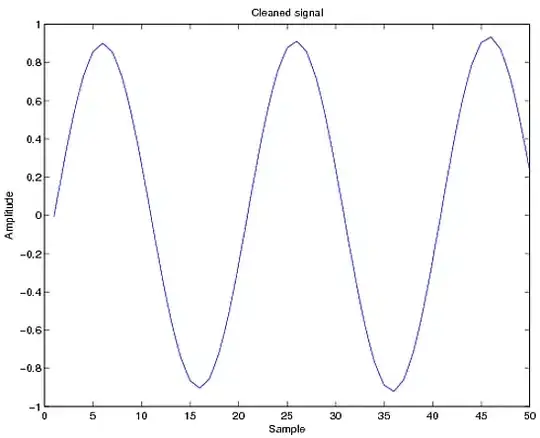
Consider a sinusoid with a frequency of 50 Hz, sampled at 1000 Hz. To that, I add Gaussian white noise such that the SNR is ~ -6dB. The original signal and the noisy signal can be seen in the top row of the figure below (only 50 samples are shown). As you can see, it almost looks as if there is no hope with the noisy signal as all structure seems to have been destroyed. However, taking an FFT, reveals the buried sinusoid (shown in the bottom row)

enter image description here

Filtering the noisy signal with a narrow band filter from 48 to 52 Hz, gives us a "cleaned" signal. There will of course be some loss in amplitude due to the noise. However, the signal has been retrieved from what looked like a lost cause at first.

enter image description here

How you proceed depends on your exact application. But I hope this helped you understand some of the basics of noise filtering.

EDIT

@Shabnam: It's been nearly 50 comments, and I really do not see you making any effort to understand or at the very least, try things on your own. You really should learn to read the documentation and learn the concepts and try it instead of running back for every single error. Anyway, please try the following (modified from your code) and show the output in the comments.

[y,fs]=wavread('100cmfreefall.wav');
ch1=y(:,1);
time=(1/fs)*length(ch1);
t=linspace(0,time,length(ch1));
L=length(ch1);
NFFT = 2^nextpow2(L);
f = fs/2*linspace(0,1,NFFT/2+1);

[b,a]=butter(10,3e3/(fs/2),'high'); 
y1=filtfilt(b,a,ch1);

figure(1)
subplot(2,1,1)
Y=fft(ch1,NFFT)/L;
plot(f,log10(abs(Y(1:NFFT/2+1))))
title('unfiltered')

subplot(2,1,2)
Y1=fft(y1,NFFT)/L;
plot(f,log10(abs(Y1(1:NFFT/2+1))))
title('filtered')
Community
  • 1
  • 1
abcd
  • 41,765
  • 7
  • 81
  • 98
  • @yoda:thanks but it's an easy example.I have a sound with different frequencies in it and some noise that if you yourself try to record a collision sound with the first second empty you can find that noise.the strange matter is that the fft of that empty and the collision in the recorded track are the same.i want to remove that kind of noise and i don't have any idea of the kind of that noise. – yuna May 04 '11 at 20:41
  • 1
    Easy examples are what lead to a better understanding of more complicated concepts. What I have explained is the basis for filtering. As I mentioned, how you proceed depends on the nature of the noise and I certainly am not going to record audio and look for hypothetical noise. Moreover, there's no guarantee that it is reproducible exactly, as the the noise could be due to your data acquisition system. I'm sorry, but what you're asking is equivalent of writing to the doctor and saying you don't feel well. There's not enough visual/audible/factual information for him to make a diagnosis. – abcd May 04 '11 at 20:54
  • @yoda:I appreciate your comment.i think a misunderstanding happened.it's about a month i'm searching for the answer and i'm familiar with your explanation.however i try more to understand identity of noises. – yuna May 04 '11 at 21:07
  • @Shabnam: Please post a plot of the fft. Perhaps we can suggest something by looking at it. You might not have enough rep to upload an image, but if you upload it somewhere and post the link here as a comment, I'll edit your post for you. – abcd May 04 '11 at 21:43
  • @Shabnam: Plot the magnitude of the FFT in MATLAB, label the axes, save the figure, upload it to http://imgur.com/ and post the link here as a comment. I'll edit the post to include the figure. – abcd May 05 '11 at 16:37
  • @Shabnam: Your frequencies are all between `0` and `5000` Hz. Can you change the `xlim` to between these so that we can see the interesting parts over the entire range? Also, is that a linear y-axis? Could you plot it in `dB` scale or a simple logarithmic plot? – abcd May 05 '11 at 17:40
  • I'll try to do it.but it may take some time.please wait.thanks – yuna May 05 '11 at 17:44
  • @yoda:excuse me because of delay.here's the link of new file.i uploaded 2 pics.the first on for alteration in the xlim and the 2nd for both http://imgur.com/XiRav&svfCIl – yuna May 06 '11 at 19:34
  • @shabnam: I've edited your post to include the plots. Your previous figure seemed to show frequency content till about 2500 Hz, whereas these are truncated at 500 Hz. Are you sure there isn't any more? Perhaps a plot till 5000Hz like I mentioned earlier might reveal more. – abcd May 06 '11 at 23:40
  • @yoda:oh!i'm so sorry.that was my fault.i didn't mentioned the other 4500 part on mistake.here's the new link :http://imgur.com/Tfx4i – yuna May 07 '11 at 10:20
  • @Shabnam: You should address me as `@yoda: ` (note the space after `:`), else I won't get your message (which is what happened in this case). I've edited the post to replace the figure. The problem looks a lot clearer now. You can clearly see two distinct regions. I presume everything below 3kHz is noise that you don't care about. You'll need either a highpass filter that kills frequencies below 3kHz, or a bandpass filter between 3-5kHz. If you look at the link I provided to a previous answer of mine, I use a bandpass filter in the example. You can easily modify that to suit your needs. – abcd May 11 '11 at 02:20
  • @yoda: oh ,i was not aware or the manual here.i was disappointed of receiving an answer.because i'm not a programmer and i didn't used filtering yet,i have plenty of problems. – yuna May 12 '11 at 17:46
  • I think that i should use high pass filter "in this case butterworth' because i want the second half's information and also i looked up MATLAB help.i think that Apass and Astop aren't used for butterworth.i used fpass=2790 and fstop=3140 in my mfile but i didn't saw much differance only a loss in thickness.the second time i used your whole mentioned code'the first grey box' and i had error while running.would you like telling me about my mistake?which codes should i use? – yuna May 12 '11 at 17:46
  • @Shabnam: Perhaps it might be easier for you if you created the filter like this: `[b,a]=butter(10,3000/(fs/2),'high');` where `fs` is your sampling frequency. You can then filter the data as `filtfilt(b,a,x)`, where `x` is your audio signal. This is a simple filter that should work on your data. You can learn more about designing filters using second order sections (which is what I used in that answer) later, if you're interested. – abcd May 12 '11 at 18:01
  • @yoda: okay.but what are a & b .by the way i have another question,why did you tell me to put the magnitude into log form?i know that we have logarithmic fft.but is it related to that?i used this code the same as you wrote but it did not emmited the noise.please forbid me for continues questions.if it's a burden on you .you can Disregard it. – yuna May 12 '11 at 20:11
  • @Shabnam: `b` and `a` are the [filter coefficients of an IIR filter](http://en.wikipedia.org/wiki/Infinite_impulse_response) that you obtain from the first statement above (see `[b,a]=butter...`). I asked you to display the plot in log scale, for a better dynamic range. Linear scale is pretty much useless in this regard. I can't really tell if it worked or not without seeing it, but you're the best judge. Could you link to a figure of the fft spectrum _after_ you've filtered the data and the figure obtained from `freqz(b,a)`? Could you also write here what your `fs` is? – abcd May 12 '11 at 20:20
  • sample rate was 44100 'according to the application,the best for my case'.here's the freqz(b,a) link:http://imgur.com/XEbwK .but i want a little more time to plot the filtered data – yuna May 12 '11 at 21:19
  • @Shabnam: The `freqz` plot is incorrect. You seem to be using `fs=10000`. Your plot should look like this: http://i.imgur.com/dI3Ls.png – abcd May 12 '11 at 21:23
  • @yoda: i'm ashamed of my mistake here's the pic.you are right.http://imgur.com/prWgb – yuna May 12 '11 at 21:39
  • @Shabnam: It's alright, we all make mistakes. Just leave a comment when you're done with the filtering. – abcd May 12 '11 at 21:42
  • @yoda: as i said,i will work on the filtered plot .thanks ;-) – yuna May 12 '11 at 21:45
  • @yoda: hi.how are you?i used the code but i don't know if it is true or not.you see that after filtering the log picture changed too.do you think that i used that in a true way?i have another question.we know that the fourier transform of a pulse should show the correct max frequencies,if we have noise or not,then why mine doesn't show that?http://imgur.com/wdnIN&4113W – yuna May 15 '11 at 16:34
  • @Shabnam: It is not clear what you are doing here. First, you haven't labeled the axes... I'll assume they're as before with `x: Frequency (Hz)` and `y: log10|Y|`. Secondly, the fft plots that you presented earlier and now don't seem to have any relation... Are you showing a different data set each time? In the image you linked to in your comment on `May 5 at 17:37`, the non-zero (practically) frequencies can be seen to be only less than 5 kHz. That was the basis for the suggestions that followed. – abcd May 15 '11 at 16:51
  • @Shabnam: (contd...) Now you're presenting an fft plot with frequencies that span all the way till your sampling frequency (and without any visible signs of aliasing!). I don't know how you managed to do that, unless of course, the labels are incorrect. It does not look like you've filtered the data correctly. Perhaps you should read more on [filters](http://en.wikipedia.org/wiki/Filter_(signal_processing)), [sampling](http://en.wikipedia.org/wiki/Sampling_(signal_processing)) and [discrete Fourier transforms](http://en.wikipedia.org/wiki/Discrete_Fourier_transform) first. – abcd May 15 '11 at 16:56
  • @Shabnam: (contd...) As for your second question, I couldn't really make out what you're getting at. Perhaps you should post that as a separate question, so that you have more space to explain your question better. – abcd May 15 '11 at 16:58
  • @yoda; no.all of them have the same sound signal.i didn't changed it.as i said it is a matter of doubt for me,too.you know that a tinny mistake in writing a code is equal to a wrong answer.i told that i am not confident of the way i did to solve the problem – yuna May 15 '11 at 17:55
  • @yoda: i think you are right for my pic dimensions.i'll check it in a few mins – yuna May 15 '11 at 17:59
  • @Shabnam: I can't help without seeing the code. You can edit the question to add the relevant parts of the code – abcd May 15 '11 at 18:01
  • @yoda: i am not that careless,but i used my old code and it contained my previous mistake imean 0 to5000 instead of 50000 the new pictures: http://imgur.com/q0DXE&deKu0 if it doesn't work .i will edit my question – yuna May 15 '11 at 18:15
  • @Shabnam: For the first image, I don't see any difference between the new pictures and the old ones posted [here](imgur.com/wdnIN&4113W). As such my comment still holds. – abcd May 15 '11 at 18:27
  • @yoda: i tried to edit my question.but regulations say i can't edit it because i have no reputations ;-(( – yuna May 15 '11 at 18:52
  • @Shabnam: You can edit your questions even without reputation. You might not be able to add images or more than one link. – abcd May 15 '11 at 18:56
  • @yoda: it didn't allow me to edit because of the picture ,but i put the mfile there. – yuna May 15 '11 at 19:04
  • @Shabnam: `filtfilt` operates in the time domain. You've passed a complex freqeuncy domain vector to it, which is what is causing problems. You should instead do `y1=filtfilthd(b,a,y)`. `y1` will now be a filtered version of your original signal `y`, in the time domain. – abcd May 15 '11 at 19:14
  • @Shabnam: Once you've done that, you can see the frequency spectrum of the filtered signal as `Y1=log10(abs(fft(y1,NFFT)));plot(f,Y1(1:NFFT/2+1));`, where `f` and `NFFT` are as defined in your script. – abcd May 15 '11 at 19:17
  • @Shabnam: Also, a couple of other errors I spotted. When you're plotting the log magnitude of the fft, you should use `log10(abs(Y))`, because you need the log of the absolute value, not of the complex number. – abcd May 15 '11 at 19:19
  • @yoda: i have ERROR on this command.i should put y1 instead of the first Y1 and y instead of the second one?in filtfilt line? – yuna May 15 '11 at 19:25
  • @Shabnam: It doesn't help if you don't tell me what error you get. If your `y` is multichanneled, then replace it with `ch1` as you have in your script. – abcd May 15 '11 at 19:29
  • @yoda: this is the error :undefined function or method 'filtfilthd' for input arguments of type 'double' – yuna May 16 '11 at 09:37
  • @Shabnam: Ah, sorry, that was supposed to be `y1=filtfilt(b,a,y)`. `filtfilthd` is only if you were following the method in my previous answer. Just delete the last two letters. – abcd May 16 '11 at 13:52
  • @yoda: i did it again but the result is the same as what you scold me because of that yesterday.http://imgur.com/fYeyh&dPrZX – yuna May 16 '11 at 14:48
  • @Shabnam: It cannot be the same. What you did earlier and this are completely different and they should not give the same answer. Are you sure you are plotting the fft of the filter output or are you still using the old code? – abcd May 16 '11 at 15:05
  • @yoda: could you write the filtfilt code and the last plot's code with the correct form of y,Y,Y1 or y1 as you think. – yuna May 16 '11 at 15:17
  • @yoda: http://imgur.com/j76SQ wow,i can't believe it.it means that i reached to the result?do you verify it?i respect your knowledge.would you like telling me that how many years you have been working on this domain?i mean programing? – yuna May 16 '11 at 18:49
  • @Shabnam: It certainly looks like you're on the right track. I cannot verify as I don't know what your requirements are... but it's much better than before. Also, since you were plotting the FFT incorrectly earlier, it looked like your signal was above 3kHz... however it seems more likely that it is below 3kHz and you might actually need a low-pass filter. This can be easily implemented by changing `'high'` to `'low'` in the code above. As for your last question, I'm not a programmer and my programming is only need based :) – abcd May 16 '11 at 19:01
  • @Shabnam: If my solution and the discussions helped you, please mark the answer as accepted by clicking on the "check mark" under the votes and the up/down arrows next to the answer. – abcd May 16 '11 at 19:02
  • @yoda: if it's possible tell me what to do?i don't know how to mark it ;-( – yuna May 16 '11 at 19:42
0

Answer to your question is highly dependent on the characteristics of what you call "noise" - its spectral distribution, the noise being stationary or not, the source of the noise (does it originate in the environment or the recording chain?).

If the noise is stationary, i.e its statistical characteristics do not change over time, you can try recording a few seconds (10-15 is a good initial guess) of noise only, preform FFT, and then subtract the value of the noise in FFT bin n from your measurement FFT bin n.

You can read some background here: http://en.wikipedia.org/wiki/Noise_reduction

Itamar Katz
  • 9,544
  • 5
  • 42
  • 74
  • thanks for your answer.i tryed smaller time range for recording but it doesn't matter befor the main sound you have one second or less.the fft of that empty range is the same as the whole sound.i think it's environmental noise and i don't understand your aim by saying stationary – yuna May 04 '11 at 07:39
  • i searched fft bin n in the net.do you mean number by 'n'.i didnot heared of fft bin yet.would you like giving me information'some links or ...' about it,please. – yuna May 04 '11 at 07:55
  • 1
    The above approach will not work. Noise is by definition, random. Subtracting one recording of noise from another recording of noise will simply double the noise variance (i.e. it will make things worse). – Oliver Charlesworth May 04 '11 at 08:24
  • do you have any recommendation?i used wavepad software to reduce the noise but it didn't changed the frequency ,only the intensity (db) will change from a negative number up to zero. – yuna May 04 '11 at 08:52
  • 1
    @ Oli Charlesworth - You are right if it is done in the time domain, but in the frequency domain noise can certainly be reduced by subtracting two values. It's exactly as applying a filter to reduce noise. I will edit my answer to make this point clearer. – Itamar Katz May 04 '11 at 09:05
  • 2
    @Itamar: Subtraction in the frequency domain is equivalent to subtraction in the time domain, as the FFT is a linear operation. A filter is *multiplicative* in the frequency domain... – Oliver Charlesworth May 04 '11 at 09:53
  • after all,what can i do now? i'm more confused.i think my professor told me sth like what mr itamar said(i mean,trying to subtract noise) but i don't know how?? – yuna May 04 '11 at 11:11
  • 2
    @Oli Charlesworth - I am talking about averaging the amplitude, by taking the `abs` of the frequency of the noise, and subtracting it from the `abs` of the frequency of the signal, and since `abs` is not a linear operation, your argument does not hold in this case. If a noisy bin is attenuated, the resulting signal is less noisy. – Itamar Katz May 04 '11 at 11:39
  • @Shabnam - fft bin is just a terminology for the value of the discrete FFT (or DFT) at a specific (quantized) frequency value. – Itamar Katz May 04 '11 at 11:45
  • @Itamar: I'm sorry, but that still won't work. The original noise recording will be uncorrelated with the signal+noise recording, even if you take the `abs`. You will still be adding uncorrelated white noise to your recording, which will increase the total noise variance. – Oliver Charlesworth May 04 '11 at 11:49
  • @itamar:a user, Tobias Kienzler, answered too and you Discussed with him.were is his comment.is it deleted? – yuna May 04 '11 at 20:33
  • @Shabnam: Yeah, @Tobias deleted his own answer. – Oliver Charlesworth May 05 '11 at 07:27