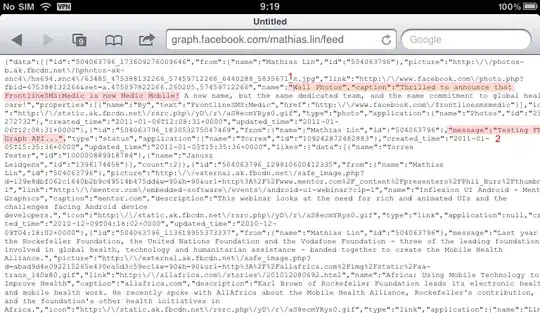
I am getting frequencies from a few rasters and am doing so in R-Markdown. I am using lapply to get the frequencies from the rasters in a list. When I store those frequencies in a list of data.frames, the chunk output displays some unexpected non-numeric characters.
Example rasters:
```{r}
require(raster)

r1 <- setValues(raster(nrows = 10, ncols = 10), sample(1:10, 100, replace = TRUE))
r2 <- setValues(raster(nrows = 10, ncols = 10), sample(1:10, 100, replace = TRUE))

rList <- list(r1, r2)
```
Getting the frequencies:
```{r}
lapply(rList, function(ras) {
  data.frame(freq(ras))
})
```
Output from the above chunk:
If I display only the data frame itself, those characters are not displayed:
```{r}
lapply(rList, function(ras) {
  data.frame(freq(ras))
})[[2]]
```
The correct values are also shown if do not use data.frame:
```{r}
lapply(rList, function(ras) {
  freq(ras)
})
```
I've tried saving the Rmd with UTF-8 encoding and am on RStudio 1.2.5019. Any ideas on how to get the list of data frames to display properly would be appreciated.
Edit: Just a note that the characters do not display in any scenario in the generated html file, only in the specific chunk in the R Notebook file itself.
Edit 2:
The full code and YAML header for the notebook that generates the strange characters is below:
---
title: "R Notebook"
output: html_notebook
---

```{r}
require(raster)

r1 <- setValues(raster(nrows = 10, ncols = 10), sample(1:10, 100, replace = TRUE))
r2 <- setValues(raster(nrows = 10, ncols = 10), sample(1:10, 100, replace = TRUE))

rList <- list(r1, r2)
```

```{r}
lapply(rList, function(ras) {
  data.frame(freq(ras))
})
```


```{r}
lapply(rList, function(ras) {
  data.frame(freq(ras))
})[[2]]
```


