This question is a continuation of my previous question here.
I have a heatmap with a dataset available. The dataset is pasted below:
library(ggplot2)
library(colorspace)

bigtest <- structure(list(x = c(-8, -7, -6, -5, -4, -3, -2, -1, 0, 1, 2, 3, 4, 5, 6, 7, 8,
                                -8, -7, -6, -5, -4, -3, -2, -1, 0, 1, 2, 3, 4, 5, 6, 7, 8, -8,
                                -7, -6, -5, -4, -3, -2, -1, 0, 1, 2, 3, 4, 5, 6, 7, 8, -8, -7,
                                -6, -5, -4, -3, -2, -1, 0, 1, 2, 3, 4, 5, 6, 7, 8, -8, -7, -6,
                                -5, -4, -3, -2, -1, 0, 1, 2, 3, 4, 5, 6, 7, 8, -8, -7, -6, -5,
                                -4, -3, -2, -1, 0, 1, 2, 3, 4, 5, 6, 7, 8),
                          y = c(0, 0, 0, 0, 0, 0, 0, 0, 0, 0,
                                 0, 0, 0, 0, 0, 0, 0, 1, 1, 1, 1, 1, 1, 1, 1, 1, 1, 1, 1, 1, 1,
                                 1, 1, 1, 2, 2, 2, 2, 2, 2, 2, 2, 2, 2, 2, 2, 2, 2, 2, 2, 2, 3,
                                 3, 3, 3, 3, 3, 3, 3, 3, 3, 3, 3, 3, 3, 3, 3, 3, 4, 4, 4, 4, 4,
                                 4, 4, 4, 4, 4, 4, 4, 4, 4, 4, 4, 4, 5, 5, 5, 5, 5, 5, 5, 5, 5,
                                 5, 5, 5, 5, 5, 5, 5, 5),
                          z = c(1281.35043, 576.76381, 403.46607,
                                363.28815, 363.13356, 335.04997, 246.93314, 191.56371, 165.35087,
                                165.35087, 136.33712, 83.91203, 107.5773, 56.91087, 56.91089,
                                54.16559, 54.18172, 1841.60838, 1098.66304, 424.80686, 363.52776,
                                363.13355, 335.04998, 246.93314, 191.69473, 165.35087, 165.35087,
                                136.33712, 83.91204, 107.57729, 56.91087, 56.91088, 54.16421,
                                54.16794, 2012.52217, 1154.7927, 446.79023, 363.31379, 363.13356,
                                335.04997, 246.93314, 191.9613, 165.35087, 165.35087, 136.33712,
                                83.91202, 107.57731, 56.91088, 56.91088, 54.1642, 54.16559, 2077.10354,
                                1217.43403, 450.18301, 363.44225, 363.13357, 363.13363, 253.99753,
                                218.43223, 165.35087, 165.35014, 136.33712, 83.91203, 107.57822,
                                82.87399, 56.91087, 54.1642, 54.1642, 2092.56391, 1229.49925,
                                451.15179, 392.30728, 363.13356, 363.13282, 264.18944, 218.4308,
                                165.35087, 165.35044, 136.33712, 83.91202, 83.92709, 82.87353,
                                82.87406, 56.54491, 54.16421, 2206.93318, 1231.66411, 457.37767,
                                392.41558, 363.13357, 363.13283, 335.06272, 191.95211, 165.35087,
                                165.35014, 136.33712, 136.35211, 112.12755, 82.73634, 82.87353,
                                82.87418, 54.16421)),
                     row.names = c(NA, -102L),
                     class = c("tbl_df", "tbl", "data.frame"))
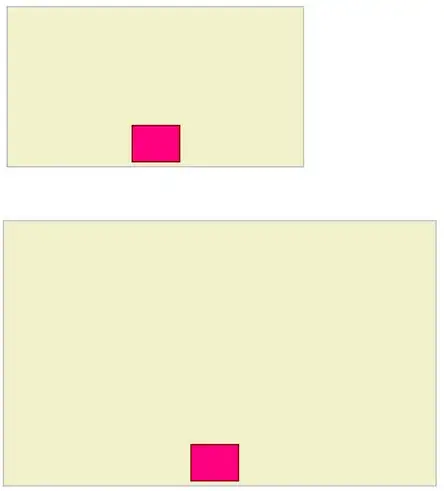
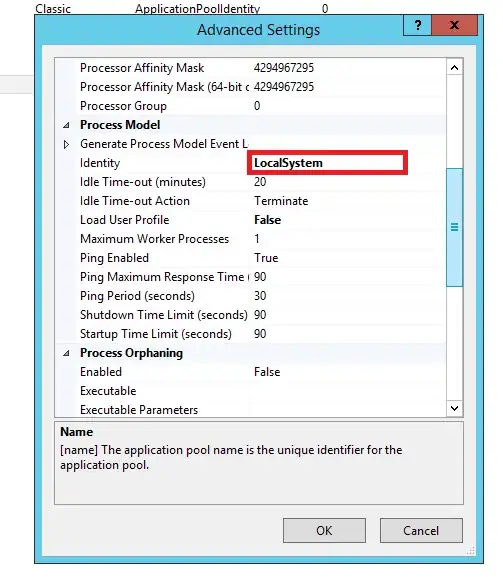
I'm generating a heatmap with the following code section:
ggplot(bigtest, aes(x = x, y = y)) +
  geom_tile(aes(fill = z)) +
  scale_fill_continuous_divergingx(palette = 'RdBu', rev = TRUE, mid = 347.48, l3 = 54, p3 = 2206, p4 = 325)

What I'm expecting from the plot is for the white color to be centered at a specific value and for the other gradients to diverge based on above or below that value. However, by working with the different parameters, it seems I don't fully understand what the parameters l3, p3, and p4 are referring to. When I was reviewing the documentation for this function it suggested that the parameters to customize the scale is from divergingx_hcl function within the colorspace package.
When reviewing the divergingx_hcl documentation it states they're coordinate corresponding to different input parameters. I'm completely lost and fully unaware of what this is. Any guidance on helping me wrap my head around these parameters (not just l3, p3, and p4 but the other parameters) would be greatly appreciated.
Created on 2019-11-07 by the reprex package (v0.3.0)