I want to plot multiple boxplots (using matplotlib in python3) into one figure and label them accordingly along the x axis. I have tried multiple methods to set custom x-ticks, but the old, numerical ticks always show through.
The following two code snippets yield the same result. In the first one, I use plt.xticks(ticks, labels, rotation='vertical') to set the ticks (also does not work w.o. rotation).
In both cases compressed_runs is a dict, where the keys coincide with the x-ticks' labels and the values are numeric arrays.
plt.figure(figsize=[10, 8], dpi=300)
labels = ['test']*len(compressed_runs)
ticks = [i+1 for i, v in enumerate(compressed_runs)]

plt.xticks(ticks, labels, rotation='vertical')
plt.ylabel('communication times [µs]')
plt.title('Test title')

plt.boxplot(compressed_runs.values(), showfliers=False)
plt.savefig(plotname)
plt.close()
I also tried modifying the figure's axes directly:
fig = plt.figure(figsize=[10, 8], dpi=300)
labels = ['test']*len(compressed_runs)
ticks = [i+1 for i, v in enumerate(compressed_runs)]

plt.xticks(ticks, labels, rotation='vertical')
fig.axes[0].set_xticklabels(labels)
plt.ylabel('communication times [µs]')
plt.title('Test title')

plt.boxplot(compressed_runs.values(), showfliers=False)
plt.savefig(plotname)
plt.close()
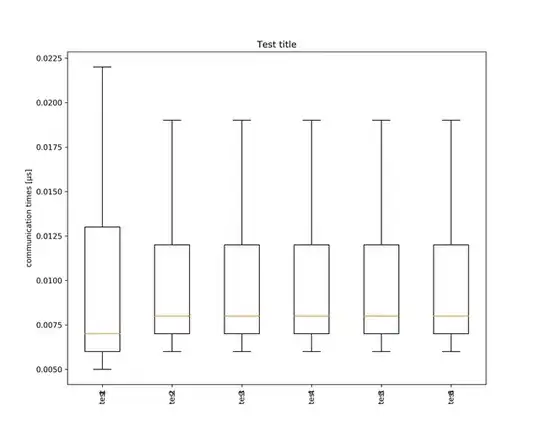
As you can see in the figure, the enumerated x-ticks still show through from underneath the named x-ticks. In this case I expect only 'test' to be under each boxplot.