5

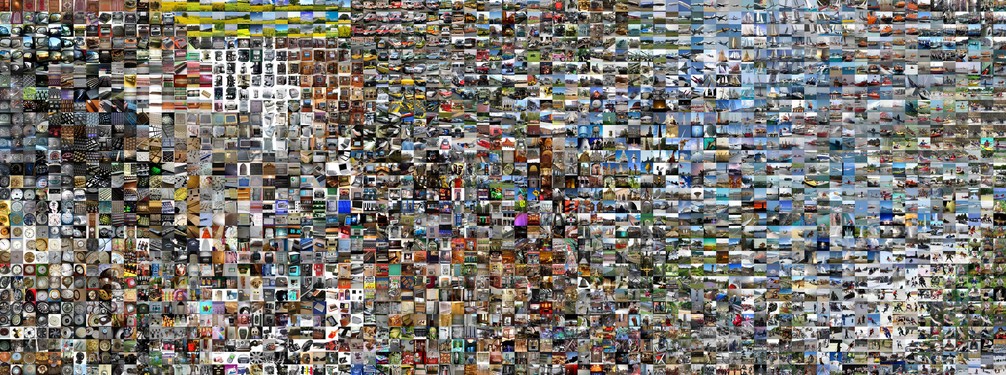
I am facing a problem of image clustering based on their similarity, without knowing the number of clusters. Ideally i would like to achieve something that resembles this http://cs231n.github.io/assets/cnnvis/tsne.jpeg (http://cs231n.github.io/understanding-cnn/ this picture is a result of convolution neural network and it represents groups it learnt)

Because I am not interested in their classification (I don't know classes), i am mostly interested in their 'visual' properties: colours, shapes, gradients etc. I have found number of articles suggesting algorithms like DBSCAN, t-SNE or even k-means but is there some better solution? There were suggestions of using HOG transformation but to be honest, no idea how to stitch it all together.

So, to summaries, how can I segregate (on 2D plane, into groups, folders, whatever) images based on their colours and shape properties?

Bartek Wójcik
  • 473
  • 3
  • 15
  • 1
    That image does *not* show a clustering, but a visualization. Make sure you have understood the different steps performed there (or not performed - no clustering). The entire topic is too complex to be just answered here - CNNs are a complex topic. Too broad to be answered / tutorial request -> voting to close as off-topic. – Has QUIT--Anony-Mousse Oct 20 '19 at 07:48
  • you are right, i needed visualisation rather than clustering. Thanks – Bartek Wójcik Oct 20 '19 at 09:27

2 Answers2

4

t-SNE is actually perfect for the thing you are trying to do.

t-Distributed Stochastic Neighbor Embedding (t-SNE) is a (prize-winning) technique for dimensionality reduction that is particularly well suited for the visualization of high-dimensional datasets.

You can read more about it here.

As always sklearn has a very user-friendly TSNE object to quickly try it out.

I hope this helps...

Sharif Elfouly
  • 508
  • 5
  • 10
1

Unfortunately image semantic dimensionality is much higher than 2D. Maybe even infinitely high. The photo you link is just a projection from high-dimensional space to a plane, and not necessarily representative of how the actual information space looks like. This specific projection visually seems to be mostly about colors.

The solution is to focus on the specific similarity metric.

For example: "does this image contain a circle?", and optimize for this. But if you want a "square", you are already in another dimension. If optimizing for color, you can look at "overall redness" or other color. The more metrics you add, the higher is your clustering dimensionality.

Our perception is like this. We aim at specific summary metric, maybe a scalar value, which is a sum of weighted metrics in different dimensions. This is a ranking problem.

For example, if you want photos with "eyes", you do not care about color variations. But if you care more about colors, shapes are less important.

From my experience, clustering is easier when pictures in each cluster are very similar by one metric and the metric is not fuzzy across clusters.

For example, one cluster is "legs", another "faces". But, if you have very diverse images of any possible subject, even with pure noise, the solution is intractable, unless you specify what exactly you want to group by.

The same applies to squeezing clusters into folders: if not well-defined, it fails.

miken32
  • 42,008
  • 16
  • 111
  • 154