Creating 2D array of the numbers
Check out the documentation for numpy's reshape function. Here you can turn your array into a 2D array by doing:
data = is_prime.reshape(10,10)
we can also make an array of the first 100 integers to use for labeling in a similar fashion:
integers = np.arange(100).reshape(10,10)
Plotting the 2D array
When plotting in 2D you need to use one of the 2D functions that matplotlib provides: e.g. imshow, matshow, pcolormesh. You can either call these functions directly on your array, in which case they will use a colormap and each pixel's color will correspond to the value in associated spot in the array. Or you can explicitly make an RGB image which affords you a bit more control over the color of each box. For this case I think that that is a bit easier to do so the below solution uses that approach. However if you want to annotate heatmaps the matplolib documentation has a great resource for that here. For now we will create an array of RGB values (shape of 10 by 10 by 3) and change the colors of only the prime numbers using numpy's indexing abilities.
#create RGB array that we will fill in
rgb = np.ones((10,10,3)) #start with an array of white
rgb[data]=[1,1,0] # color the places where the data is prime to be white
plt.figure(figsize=(10,10))
plt.imshow(rgb)
# add number annotations
integers = np.arange(100).reshape(10,10)
#add annotations based on: https://stackoverflow.com/questions/20998083/show-the-values-in-the-grid-using-matplotlib
for (i, j), z in np.ndenumerate(integers):
plt.text(j, i, '{:d}'.format(z), ha='center', va='center',color='k',fontsize=15)
# remove axis and tick labels
plt.axis('off')
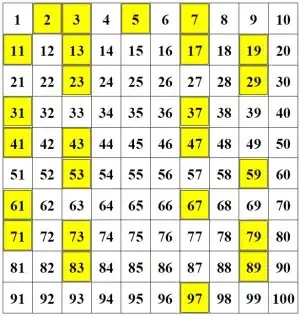
plt.show()
Resulting in this image: