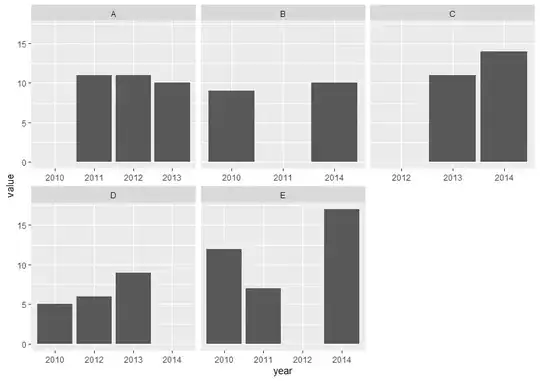
When facetting barplots in ggplot the x-axis includes all factor levels. However, not all levels may be present in each group. In addition, zero values may be present, so from the barplot alone it is not possible to distinguish between x-axis values with no data and those with zero y-values. Consider the following example:
 library(tidyverse)
 set.seed(43)
 site <- c("A","B","C","D","E") %>% sample(20, replace=T) %>% sort()
 year <- c("2010","2011","2012","2013","2014","2010","2011","2012","2013","2014","2010","2012","2013","2014","2010","2011","2012","2014","2012","2014")
 isZero = rbinom(n = 20, size = 1, prob = 0.40)
 value <- ifelse(isZero==1, 0, rnorm(20,10,3)) %>% round(0)
 df <- data.frame(site,year,value)

ggplot(df, aes(x=year, y=value)) +
  geom_bar(stat="identity") +
  facet_wrap(~site)
This is fish census data, where not all sites were fished in all years, but some times no fish were caught. Hence the need to differentiate between the two situations. For example, there was no catch at site C in 2010 and it was not fished in 2011, and the reader cannot tell the difference. I would like to add something like "no data" to the plot for 2011. Maybe it is possible to fill the rows where data is missing, generate another column with the desired text to be added and then include this via geom_text?

