2

I need these two things to happen:

  1. Layer (map) 1: These map elements in the legend should not have border line (colour = NA)!

  2. Layer (map) 2: This map element in the legend should have a red border line (colour = "red").

Problem: When I add "layer 2", all map elements in the legend of "layer 1" also change their border to red.

Note: This only happens in the legend! The map borders do not change, they are plotted correctly.

Here is an example to run in R:

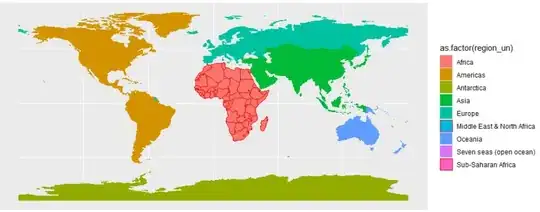
Running only layer 1, is correct, the elements on the map and the legend have no border color:

library("sf"); library("ggplot2")
library("rnaturalearth"); library("rnaturalearthdata") #packages containing the example layers

layer1 <- ne_countries(returnclass = "sf")

ggplot() +
  geom_sf(data = layer1, #layer 1
          aes(fill = as.factor(region_un)), # example of variable
          colour = NA) # removing the borders

Layer 1 with no border color in the element of legend:

img1

However, when adding a second layer, all elements have a red border, including layer 1:

layer2 <- layer1[layer1$region_un == "Africa", ] # layer 2

ggplot() +
  geom_sf(data = layer1, #layer 1
          aes(fill = as.factor(region_un)),
          colour = NA) + # removing the borders
  geom_sf(data = layer2 , #layer 2
          aes(fill = region_wb), 
          alpha = 0, # transparent fill
          colour = "red") # red border line 

Layer 1 and layer 2, with all elements of legend with red border color:

img2

  • 3
    Does using `show.legend = FALSE` in the second layer help? That's what I'd try first. – aosmith Oct 03 '19 at 16:19
  • This argument removed the border from all elements in the legend. However, I would like the elements in the second layer to have a red border line. – Patricia Bermudi Oct 07 '19 at 13:23
  • In that case I'm guessing you'll need something a bit more complicated, possibly with `override.aes` in `guide_legend()`, to take out the outlines for the groups in only the first layer. – aosmith Oct 07 '19 at 14:08
  • I added (+) this command line and now it worked! `guides(fill = guide_legend (override.aes = list(colour = c(NA, NA, NA, NA, NA, "red", NA, NA, "red"))))` – Patricia Bermudi Oct 22 '19 at 18:06

1 Answers1

1
library("sf"); library("ggplot2")
library("rnaturalearth"); library("rnaturalearthdata") #packages containing the example layers

layer1 <- ne_countries(returnclass = "sf")

layer2 <- layer1[layer1$region_un == "Africa", ] # layer 2

ggplot() +
  geom_sf(data = layer1, #layer 1
          aes(fill = as.factor(region_un)),
          colour = NA) + # removing the borders
  geom_sf(data = layer2 , #layer 2
          aes(fill = region_wb), 
          alpha = 0, # transparent fill
          colour = "red") + # red border line 
  guides(fill = guide_legend ( 
                   override.aes = list(colour = c(NA, NA, NA, NA, NA, "red", 
                                                  NA, NA, "red"))))

enter image description here