I'm using the basemap library to display spatial information from Copernicus program. The issue is i can not figure out how to project the data on the robin projection, but I do it correctly with the orthogonal projection.
So currently, I tried this :
plt.ioff()
# adapt for location of datasources
filePath = '../data/grib/download.grib'
# load data
grbs = grb.open(filePath)
grbs.seek(0)
data, lats, lons = (None, None, None)
dataUnit = None
title = None
for g in grbs:
data, lats, lons = g.data()
name = g.name
level = g.level
pressureUnit = g.pressureUnits
date = g.validDate
dataUnit = g.units
title = name + ' at ' + str(level) + ' ' + str(pressureUnit) + ' [' + str(date) + ']'
print(title)
break
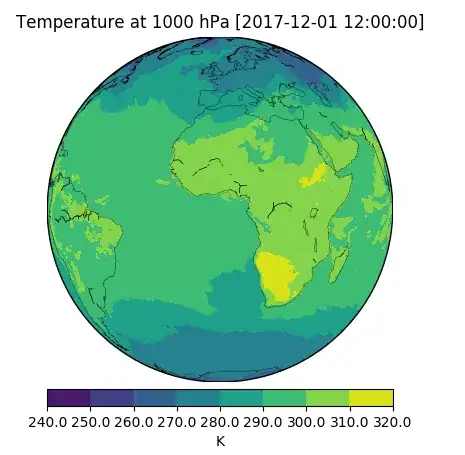
# mapPlot = Basemap(projection='ortho', lat_0=0, lon_0=0)
mapPlot = Basemap(projection='robin', lat_0=0, lon_0=0, resolution='l')
mapPlot.drawcoastlines(linewidth=0.25)
x, y = mapPlot(lons, lats)
mapPlot.contourf(x, y, data)
mapPlot.colorbar(location='bottom', format='%.1f', label=dataUnit)
plt.title(title)
plt.show()
The orthogonal projection works correctly. But for the robin projection, I have an ... interesting pattern.
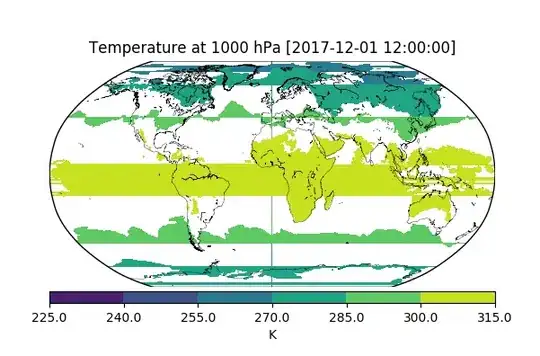
What I'm doing wrong ?