I can get correct R plots with text labels (ggplot and ggrepel) from a remote R plot function through opencpu API, but get wrong plots through ocpu.rplot call, using opencpu-0.4.js, with the same remote R plot function. The wrong plot got no text labels on them.
I write a small reproducible example for this problem: HTML code: https://github.com/cywhale/ODB/blob/master/opencpu_test/ocpu_test.html
in this html js, use opcu.call rplot to call plot_test API to plot, and session.getLoc() to get R graphics in R/.val/png, put both two graphics in the same html
Run this html and get the reproducible results on my server: https://bio.odb.ntu.edu.tw/test/ocpu_test.html
A remote R plot function : plot_test()
#' generate a test graph by ggplot+ggrepel, use offical ex: https://cran.r-project.org/web/packages/ggrepel/vignettes/ggrepel.html
#' @return A ggplot graph
#' @examples plot_test()
#' @rdname plot_test
#' @export
plot_test <- function() {
  set.seed(42)
  data("mtcars")
  dat2 <- subset(mtcars, wt > 3 & wt < 4)
  # Hide all of the text labels.
  dat2$car <- ""
  # Let's just label these items.
  ix_label <- c(2,3,16)
  dat2$car[ix_label] <- rownames(dat2)[ix_label]

  g1 <- ggplot(dat2, aes(wt, mpg, label = car)) +
    geom_point(color = ifelse(dat2$car == "", "grey50", "red")) +
    geom_text_repel()

  print(g1)
}
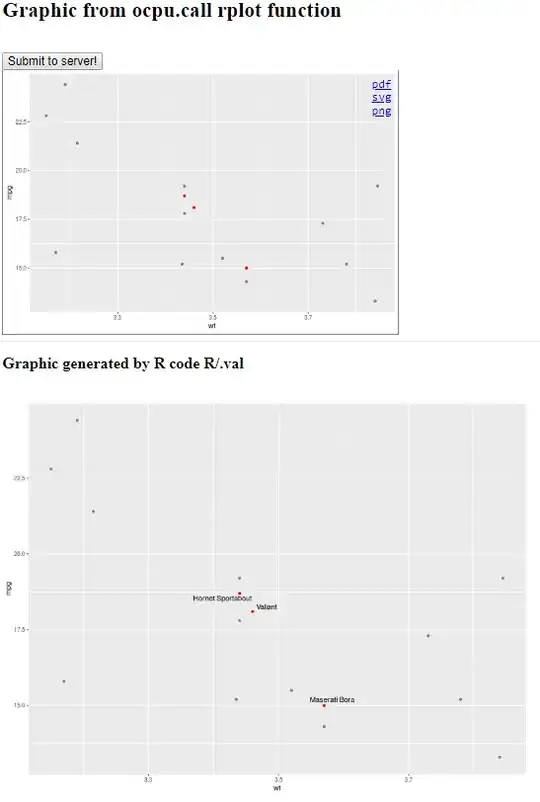
The two graphics are different. The texts and labels that use ggrepel package disappear in ocpu.call rplot. But in R/.val/png, the graphics is correct. Expect that ocpu.call rplot should return the correct plot with labels as the results in R/.val/png. Appreciate any comments that may help to clarify or solve this problem. Thanks.