I am totally new to Power BI, so your help would be much appreciated. I have gone through a couple of beginners tutorials and am now trying to practice by creating my own dashboards.
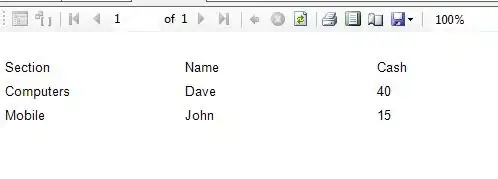
If I have a table that looks like this:

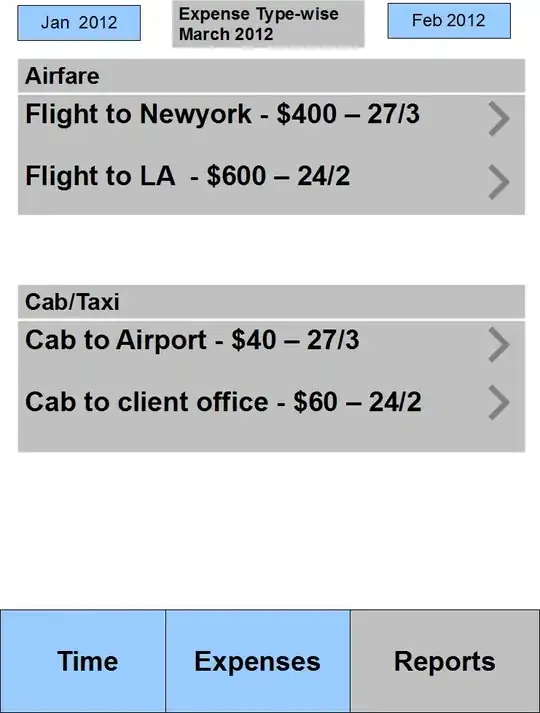
I want to have the dashboard let me select (by clicking) the person I want to view, and once clicked, it should highlight (change color) of the names of the sports that they play.
Examples:
and:
How would I go about accomplishing that?
Thank you for your time!
I've looked into several visualization options, but I believe I am missing something still in terms of knowing functionality.