I apologise for the somewhat confusing title.
I am trying to fit a specific set of data (DATA FILE HERE) to a model comprised of three sigmoidal functions, as described below.
def sigmoid(p,x):
    x01,c1,k1,x02,c2,k2,x03,c3,k3,y0=p
    y = (c1 / (1 + np.exp(-k1*(x-x01)))) + (c2 / (1 + np.exp(-k2*(x-x02))))+(c3 / (1 + np.exp(-k3*(x-x03)))) + y0
    return y


#model for curve with 3 sigmoidal transitions, where:

# y0 = y initial value
# x0, x02, x03 = the x-value of the sigmoid's midpoint
# c1, c2, c3 = the curve's maximum value
# k1, k2, k3= the logistic growth rate or steepness of the curve
When I run the full script (which is provided further down), I get the following example as result:

As it is seen, the values for c, x0, and k are not in a crescent order (i.e.: c2 has a smaller value than c3, which per consequence has a smaller value than c1). Could anyone explain me why this is happening and how I can solve the issue? I do need the parameters to be in crescent order relative to x (c1>c2>c3), as I will later store them in variables to be used as statistical entities.
In some situations, I also get negative values for c, k, and x0, as elucidated in the following pictures

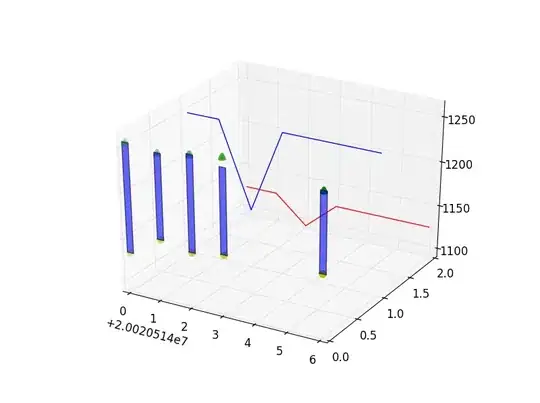
Is there any way to solve this issue in order to always get positive values for the fitting parameters? Or am I not doing the fitting properly?
Here is a sample of the code I'm running:
import numpy as np
import pandas as pd
import scipy.optimize
from scipy.optimize import  curve_fit
import matplotlib.pyplot as plt

def sigmoid(p,x):
    x01,c1,k1,x02,c2,k2,x03,c3,k3,y0=p
    y = (c1 / (1 + np.exp(-k1*(x-x01)))) + (c2 / (1 + np.exp(-k2*(x-x02))))+(c3 / (1 + np.exp(-k3*(x-x03)))) + y0
    return y


#model for curve with 3 sigmoidal transitions, where:

# y0 = y intitial value,
# x0, x02, x03 = the x-value of the sigmoid's midpoint,
# c1, c2, c3 = the curve's maximum value
# k1, k2, k3= the logistic growth rate or steepness of the curve


def residuals(p,x,y):
    return y - sigmoid(p,x)


url=r'/Users/user/Downloads/RawDataEclipse (1).xlsx'

for i in range(12):

    #data raw
    df  = pd.read_excel(url, sheet_name=i,sep='\s*,\s*') # we use index_col=0 to indicate that first row in the dataset is the index column
    #df.rename(columns={ df.columns[1]: "Time_1", df.columns[3]: "Time_2"}) #rename columns which have the same name
    x1=np.array(df['Time'], dtype=float)
    y1=np.array(df['Intensity330'], dtype=float)
    x2=np.array(df['Time.1'], dtype=float)
    y2=np.array(df['Intensity330'], dtype=float)
    x3=np.array(df['Time.2'], dtype=float)
    y3=np.array(df['Intensity490\'Time'], dtype=float)
    p_guess=(0,0,0,0,0,0,0,0,0,0)

    #fits
    p1, cov1, infodict1, mesg1, ier1 = scipy.optimize.leastsq(residuals,p_guess,args=(x1,y1),full_output=1)
    p2, cov2, infodict2, mesg2, ier2 = scipy.optimize.leastsq(residuals,p_guess,args=(x2,y2),full_output=1)
    p3, cov3, infodict3, mesg3, ier2 = scipy.optimize.leastsq(residuals,p_guess,args=(x3,y3),full_output=1)
    x011,c11,k11,x021,c21,k21,x031,c31,k31,y01=p1
    x012,c12,k12,x022,c22,k22,x032,c32,k32,y02=p2
    x013,c13,k13,x023,c23,k23,x033,c33,k33,y03=p3
    print('''\

        DATA FIT 330 a.u.:


        x0 step 1= {x011}
        x0 step 2= {x021}
        x0 step 3= {x031}
        y0= {y01}
        c step 1= {c11}
        c step 2= {c21}
        c step 3= {c31}
        k step 1 = {k11}
        k step 2 = {k21}
        k step 3 = {k31}
        '''.format(x011=x011,c11=c11,k11=k11,x021=x021,c21=c21,k21=k21,x031=x031,c31=c31,k31=k31,y01=y01))

    print('''\

        DATA FIT 350 a.u.:


        x0 step 1= {x012}
        x0 step 2= {x022}
        x0 step 3= {x032}
        y0= {y02}
        c step 1= {c12}
        c step 2= {c22}
        c step 3= {c32}
        k step 1 = {k12}
        k step 2 = {k22}
        k step 3 = {k32}
        '''.format(x012=x012,c12=c12,k12=k12,x022=x022,c22=c22,k22=k22,x032=x032,c32=c32,k32=k32,y02=y02))

    print('''\

        DATA FIT 490 a.u.:


        x0 step 1= {x013}
        x0 step 2= {x023}
        x0 step 3= {x033}
        y0= {y03}
        c step 1= {c13}
        c step 2= {c23}
        c step 3= {c33}
        k step 1 = {k13}
        k step 2 = {k23}
        k step 3 = {k33}
        '''.format(x013=x013,c13=c13,k13=k13,x023=x023,c23=c23,k23=k23,x033=x033,c33=c33,k33=k33,y03=y03))


    pxp1=sigmoid(p1,x1)
    pxp2=sigmoid(p2,x2)
    pxp3=sigmoid(p3,x3)

    #Plot the results
    plt.plot(x1, y1, '.', label='data i330')
    plt.plot(x1, pxp1, label='fit i330')
    plt.plot(x2, y2, 'v', label='data i350')
    plt.plot(x2, pxp2, label='fit i350')
    plt.plot(x3, y3, '^', label='data i490')
    plt.plot(x3, pxp3, label='fit i490')
    plt.xlabel('Time (min)')
    plt.ylabel('Intrinsic Fluorescence (a.u.)')
    plt.grid(True)
    plt.legend()
    plt.show()